Transmission Lines
760 likes | 1.82k Views
2014 Transmission & Distribution Benchmarking Insights Conference. Transmission Lines. August 20-22, 2014 Vail , CO. Agenda. Picture source: www.energy.gov. Introduction Statistics and System Activity Financial Initiatives and Practices. Key benchmarking Issues in Transmission.

Transmission Lines
E N D
Presentation Transcript
2014 Transmission & Distribution Benchmarking Insights Conference Transmission Lines August 20-22, 2014 Vail, CO
Agenda Picture source: www.energy.gov • Introduction • Statistics and System Activity • Financial • Initiatives and Practices
Key benchmarking Issues in Transmission Industry Methodology Regulatory • NERC regulations; other Regulatory bodies • NERC compliance audits • NERC performance standards (TADS) System Challenges • Distributed Generation • Interconnections (e.g. Windmill Farms) • Aging infrastructure • New transmission corridors • ROW management under increasing regulations and restrictions • Capacity Constraints • Transfer Capability Crisis (mitigated by the recession) • Intelligent Grid (or more intelligent Grid) • Upgrading EMS systems • Equipment lead times Organizational Challenges • Aging Workforce -- Brain Drain • Contractor Management • Cross-silo prioritization and involvement in projects • 2014: • Cyber security • Physical security • FERC politicization • Transmission Systems are unique and designed to serve a particular geography, customer base, and other generation source and load constraints. • Costs are particularly uneven over time, so really need to be evaluated on a longer time horizon. • FERC capital additions do not reflect actual spending because of CWIP; Activity –based costs provide a more realistic spending level as well as the purpose of expenditures. • There is no agreement on cost normalization; asset base is the best predictor, but circuit miles, structure miles, MWh transmitted, MW-miles can be used to “triangulate” your performance. • Reliability is based primarily on “availability”, but also on contribution to ”End use” Customer reliability.
Transmission Line Spending • We saw increase in spending in 2013 . . .
Total Transmission Capital Additions: US Utilities • Total market size for the US for the last 7 years has grown consistently, following a drop off during the recession. Only a portion of this will be for labor costs since some portion will be for materials. This is total US utility population – FERC Capital Additions. Capital additions represents capital spending that closed to the books and became part of the asset base in the given year.
2014T&D: Capital Projects CAPITALPROJECTSPENDINGPERASSETNEXT3YEARS-TRANSMISSION MeanQuartile Mean 39% Comments Calculation used ( CP125.1A ) / ( TF65.1 ) * 100 , ( CP125.2A ) / ( TF65.1 ) * 100 , ( CP125.3A ) / ( TF65.1 ) * 100
Statisticsand System Activity Landsnet – National Grid, Iceland
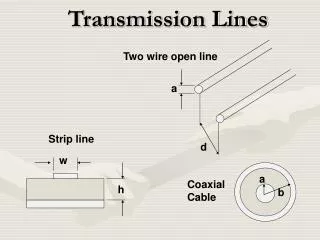
Transmission versus Distribution • For purposes of this survey, we define distribution to be a voltage level of 45kV and below. The distinction is somewhat arbitrary, but picks a point between 69kv which is generally considered a transmission (or at least sub-transmission) level and 21kV which would generally be considered distribution. • It is unrealistic to ask utilities to redefine their cost or reliability reporting on the basis of these definitions. However, a utility that has very different definitions may want to restate these statistics to better compare their performance. • Distribution Voltage Classes • 5kV class (>1kV, <=9kV) • 15kV class (>9kV, <=15kV) • 25kV class (>15kV to <=26kV) • 35kV class (>26kV to <=36kV) • 44kV class (>36kV to <=44kV) Transmission classes >=45kV • <69kV class (>=45kV <69kV) • 69kV class (>=69kV <100kV) • 100kV class (>=100kV <200kV) • 200kV Class (>=200kV <300kV) • 300kV Class (>=300 kV <400 kV) • 400kV and above
TYPESOFTRANSMISSIONSTRUCTURESONSYSTEM Calculationused ST150.1/(ST150.1+ST150.2+ST150.3+ST150.4)*100 , ST150.2/(ST150.1+ST150.2+ST150.3+ST150.4)*100 , ST150.3/(ST150.1+ST150.2+ST150.3+ST150.4)*100 , ST150.4/(ST150.1+ST150.2+ST150.3+ST150.4)*100 ST p28
TRANSMISSIONVOLTAGESONSYSTEMBYOHCIRCUIT Calculationused ST120.3C/(ST120.1C+ST120.2C+ST120.3C+ST120.4C+ST120.5C+ST120.6C)*100,ST120.4C/( ST120.1C+ST120.2C +ST120.3C+ST120.4C+ST120.5C+ST120.6C)*100, ST120.5C/(ST120.1C+ST120.2C+ST120.3C+ST120.4C+ST120.5C+ST120.6C)*100,ST120.1C/( ST120.1C+ST120.2C +ST120.3C+ST120.4C+ST120.5C+ST120.6C)*100, ST120.2C/(ST120.1C+ST120.2C+ST120.3C+ST120.4C+ST120.5C+ST120.6C)*100,ST120.6C/( ST120.1C+ST120.2C +ST120.3C+ST120.4C+ST120.5C+ST120.6C)*100 ST p29
TRANSMISSIONCIRCUITMILESPERTRANSMISSIONCIRCUIT Calculationused (ST120|5_TransOH&UGCircMilev.13)/(ST120.1C+ST120.2C+ST120.3C+ST120.4C+ST120.5C+ST120.6C) ST p30
TRANSMISSIONLINESPLANTINSERVICEPERCIRCUITMILE Calculationused TF65.1/(ST120_TransCircMile09) ST p39
2014T&D:SystemActivity \ NEWTRANSMISSIONCIRCUITMILES MeanQuartile Mean 0.84 % Comments Calculationused SA55.1/(ST120_TransCircMile09)*100
Financial – Overview of the Cost Model Working with an adjusted FERC model Conceptual transmission tower design by Choi Shine Architects
Transmission line Cost Profile Median investment rate is high compared to last year
FERC: The ADJUSTED FERC COST MODEL FERC provides a general framework • Certain costs must be excluded to provide fair comparisons that focus on operations • Substation costs must be separated out, including certain allocations Substations
FERC: Specific Adjustments • The following page is a schematic of how basic FERC cost data will be adjusted for this benchmarking study. • A&G costs will be excluded – Utilities are asked to adjust their costs to exclude costs typically reported as A&G (e.g. pensions and benefits) from their O&M data. • General plant costs will be excluded – Utilities are asked to adjust their costs to exclude costs typically reported as General Plant (e.g. IT/Communications infrastructure) from their T&D Capital data. • Other T&D Capital exclusions: • Transmission: Land acquisitions and extraordinary items • Distribution: Land acquisitions, street lighting and extraordinary items • Other O&M exclusions: • Transmission: Wheeling, Rents/Leases, IT costs, extraordinary items. If you charge IT support to account 569, you should exclude it. Regional Market Expenses (Accts 575, 576). • Distribution: Streetlight Maintenance, Rents/Leases, IT costs, extraordinary items. If you charge IT support to Distribution O&M accounts, you should exclude it. • If you normally charge R&D, such as EPRI dues, to O&M, include it, unless it is an unusually large amount for this year • Substation costs will be allocated from Transmission and Distribution accounts, and similar adjustments made. • The goal of the exclusions is to provide a fairer comparison of T&D operational performance, by excluding certain costs that relate to demographic differences not under the control of T&D management.
DV|%OFFERC-TRANSMISSIONLINECAPITAL • Very few adjustments to Capital Additions (FERC) beyond Substation allocations . . . Calculationused ( TF5.6 )/TF5.1*100,TF5.2/TF5.1*100,TF5.3/TF5.1*100 , TF5.4/TF5.1*100,TF5.5/TF5.1*100 TF p32
TRANSMISSIONLINEO&M&CAPITALPERASSET[FERC] Calculationused (TF20_TransLinesO&MFERC)/TF65.1*100,(TF5_TransLinesCapitalFERC)/TF65.1*100 TF p2
DV|%OFFERC-TRANSMISSIONLINEO&MEXPENSE Comments • Wheeling Expense and Revenue is not included. The O&M cost is a measure of operational efficiency, not economic efficiency. Calculationused TF20.8/TF20.1*100,TF20.2/TF20.1*100,TF20.3/TF20.1*100 ,TF20.4/TF20.1*100 ,TF20.5/TF20.1*100 ,TF20.6/TF20.1 *100,TF20.7/TF20.1*100 TF p33
FINANCIALCOSTSADJUSTMENTS-TRANSMISSIONO&M Comments Calculationused TF20.8/TF20.1*100,TF20.2/TF20.1*100,(TF20.3+TF20.4+TF20.5+TF20.6+TF20.7 )/TF20.1*100 TF p34
Financial – Overview of the activity-based Cost Model Photo source: Scientific American
A Process Model for Managing the Network Respond to Emergencies Add New Customers Sustain Network Expand Network Operate Network Project/Portfolio Management Develop and Approve Asset Plans Develop Network Strategy
ACTIVITY-BASED Cost Model • While FERC has the benefit of being a uniform system of accounts, there are several important shortcomings: • FERC capital spending lags behind actual spending; costs for large projects go into a Construction Work in Progress (CWIP) account and are not transferred until the assets are placed into service, sometimes a several year lag. • FERC capital accounts generally follow plant accounts and units of property (e.g. poles, towers, and fixtures) – not the typical reasons why utilities spend (e.g. new business) • FERC O&M accounts tend to be more activity-oriented, but do not necessarily track important categories (e.g. vegetation management) • For those reasons, a simplified Activity-Based Costing system was developed to get current year spending by activity. The following diagram depicts the Activity-Based approach
2014 Data Collection Guide Activity-Based Cost Model • Transmission Line Capital • Serve New • Expand • Sustain • Other • CIAC • T&D Substation Capital • Serve New • Expand • Sustain • Other • CIAC • Distribution Line Capital • Serve New • Expand • Sustain • Other • CIAC • Transmission Line O&M • Sustain the Network • Operate the Network • T&D Substation O&M • Sustain the Network • Operate the Network • Other • Distribution Line O&M • Sustain • Other The activity-based cost model breaks the expenditures into capital and O&M, and then splits them into the activities shown on the process model introduced above. The following 3 pages provide more details of the individual activities for Transmission, Substations, and Distribution.
2014 Data Collection Guide Activity Based Costs – Transmission Lines • Transmission Line Capital • Serve New: Extension to new customers or utility substations [Industrial/Generation/Wholesale] • Expand: Capacity Additions (Adding additional lines to existing substations, increasing capacity of existing lines) • Sustain: Replace/Repair in kind • Sustain: system improvements (reliability/efficiency) • Sustain: Service Restoration • Sustain: Line Relocations • Sustain: Transmission Operations Center • Sustain: Asset Retirement Costs for Transmission Plant (FERC 359.1) • Other • CIAC • Transmission Line O&M • Inspection and Maintenance Expense (except 569.1-4) • ROW/Vegetation Management • Service Restoration • Transmission Operations Center • Engineering/Design O&M (including FERC 561.5-8) • Other While capital expenditures are split among several different processes from the overall process model, O&M expenses are almost entirely associated with sustaining the network.
Transmission Line: Replacement Capital Spending 2013 saw a relatively high rate of total capital spending …
TRANSMISSIONLINECAPITALSPENDINGPERASSET[ACTIVITY-BASED][V.14]TRANSMISSIONLINECAPITALSPENDINGPERASSET[ACTIVITY-BASED][V.14] Calculationused TF45.1/TF65.1*100,TF45.2/TF65.1*100,TF45.3/TF65.1*100 ,TF45.1/TF65.1*100 ,TF45.4/TF65.1*100 ,TF45.5/TF65.1 *100,TF45.6/TF65.1*100 ,TF45.1/TF65.1,TF45.7/TF65.1*100 TF p11
TRANSMISSIONLINECAPITALSPENDING SUSTAIN - EXSERVENEW,EXPANDPERASSET[ACTIVITY-BASED][V.14] Comments • #31 has very high TOC capital activity cost • See change in title to refer to “Sustain” Calculationused TF45.1/TF45.1/1000000 ,TF45.2/TF45.2/1000000 ,TF45.3/ TF65.1*100 ,TF45.1/TF65.1*100 ,TF45.4/TF65.1*100 , TF45.5/TF65.1*100,TF45.6/TF65.1*100,TF45.1/TF65.1 , TF45.7/TF65.1*100 TF p13
OTHERACTIVITYBASEDCOSTS:TRANSMISSIONLINECAPITALSPENDING Calculationused TF46.1
2014T&D:TransmissionFinancials TRANSMISSIONLINEO&MEXPENSEPERASSETS[ACTIVITY-BASED][V.14] Comments Comments #359 has reporting anomalies Calculationused TF55.1/TF65.1*100,TF55.1/TF65.1*100,TF55.2/TF65.1*100 ,TF55.4/TF65.1*100 ,TF55.5/TF65.1*100 ,TF55.1/TF65.1 *100,TF55.6/TF65.1*100
OTHERACTIVITYBASEDCOSTS:TRANSMISSIONLINEO&M Calculationused TF56.1 Comments TF p23
CWIPASA%OFCAPITALEXPENDITURES-TRANSMISSIONLINE Comments #32 very low CWIP #28 very high CWIP Calculationused TF80.1/TF5.6*100 TF p24
Vegetation Management Expense/Acre Trimmed (TF 29) Expense/Miles Managed (TF p27) Expense/Acre Managed (TF p28) 10x Q2 2012 (N=5) Expense/Mile Trimmed (TF p30) 5x
2014T&D:TransmissionFinancials FERCVSACTIVITYSPENDING:TRANSMISSIONLINEO&MPERASSET[V.14] Comments Calculationused TF20.8/TF65.1*100,(TF55_ABCTransLineO&Mv.14)/TF65.1*100
2014T&D:TransmissionFinancials FERCVSACTIVITYSPENDING:TRANSMISSIONLINECAPITALPERASSET[V.14] Comments Calculationused TF5.6 /TF65.1*100,(TF45_TransLineCapABCv.14)/TF65.1*100
Things I would like to know about transmission? • Related consulting studies: • Project level benchmarking • Project management best practices • Construction Competiveness • The drivers of work • How much are companies spending? • On what activities? • What is driving spending? • Role of Interconnections? • Regional differences? • How do designs influence cost? • How are companies overcoming community resistance or NIMBY? • What is the response to the terrorist threat? • What does NERC/FERC require? Organizing to do “new” and “expand” work • How are companies organizing to meet workload? • How are companies managing projects? • What are the challenges in contracting? • Where do companies get the skilled labor? • How are companies organizing to meeting regulatory requirements? • Organizing to do the “sustain” work • What are the challenges in ROW and vegetation management? • How are companies dealing with maintenance, especially wood pole replacement? • How are companies dealing with relocations?
A Process Model for Managing the Network Respond to Emergencies Add New Customers Sustain Network Expand Network Operate Network Project/Portfolio Management Develop and Approve Asset Plans Develop Network Strategy Developing Regulatory Strategy regarding transmision operations is increasingly important
Transmission Line Practices/initiatives 2014 Sections (by process) • Strategy • Regulatory Strategy (including NERC compliance) • Operational Strategy (including Transmission Planning and Automation) • Asset Management • Capital project and program management • Transmission Operations Center (TOC) • Sustain Activity and Respond to Emergencies (Maintenance, including ROW) • New Customers and Expand Activity (including Engineering/Design, New customers • T-line Field Construction Activities (including WMS and Contractor Productivity) • 2013 Sections • Asset Management -- Role of Asset Management, replacement programs, and problematic equipment • Planning/Engineering/Design –Improvement initiatives and changes to standards • T-line Field Activities – Initiatives underway and maintenance approaches • Work management systems – WMS Vendor and efforts to improve usefulness • Contractor Productivity – Challenges, measures and initiatives • Transmission Operations Center (TOC) – Changes and challenges. • Right of Way –Growth inhibitors, ROW uses, challenges and practices. • Transmission Automation – Technology initiatives underway • NERC Standards – Impact of NERC standards on transmission organizations, especially Critical Infrastructure Protection (CIP), Protection and Control (PRC), and Facilities Design (FAC). • Maintenance – Inspections, impact of deferred maintenance, initiatives to reduce outages
“Under Mr. Bay, the Office of Enforcement has also focused on the reliability arena. For example, the Office of Enforcement has launched investigations, at times contemporaneous with investigations led by the North American Electric Reliability Corporation (NERC) and other regulators, into various weather-related blackouts, including the October 2011 snowstorm in the Northeast and, earlier that year, outages in the Southwest. In testimony before the Senate Committee on Energy and Natural Resources regarding the October 2011 outages, Mr. Bay stated, “there is room for improvement” in utilities’ “vegetation management and other practices to reduce transmission outages during snowstorms and similar weather events.”6 Thus, the physical security of the grid may well be another top priority if Mr. Bay is confirmed. A natural corollary to physical security of the grid is cybersecurity of the grid, which would likely be another area of focus for Mr. Bay—especially since the Obama Administration has made it an executive priority in recent years”
FERC ORDER 1000 • “Order 1000 is as complicated as many of the other rules FERC has finalized and published over its history, many of which foil all but specialists. But at its heart it deals with the simple issue of whether states can be forced to coordinate on transmission planning and meeting cost obligations for new electricity transmission capacity. The order, which is now at the mercy of pending and still nascent court filings, says that states can be compelled.” • Final Briefing on Final Rule on • Transmission Planning and Cost Allocation by Transmission Owning and Operating Public Utilities Briefing on Order No 1000” • Order No. 888 in 1996 Requires open access to transmission facilities to address undue discrimination and to bring more efficient, lower cost power to the Nation's electricity consumers • Order No. 890 in 2007Requires coordinated, open and transparent regional transmission planning processes to address undue discrimination • Order No. 1000 in 2011 • Requires transmission planning at the regional level to consider and evaluate possible transmission alternatives and produce a regional transmission plan • Requires the cost of transmission solutions chosen to meet regional transmission needs to be allocated fairly to beneficiaries “
FERC ORDER 745 • “Demand response was dealt a blow on Friday when the U.S. Court of Appeals in Washington, D.C. vacated the Federal Energy Regulatory Commission’s Order 745 in a 2-1 decision, stating that FERC has gone too far. • FERC’s Order 745, approved in 2012, calls for grid operators to pay the full market price, known as the locational marginal price, to economic demand response resources in real-time and day-ahead markets as long as dispatching DR is cost-effective. The ruling found that FERC overstepped its jurisdiction and that the decision of payments should lie with states. • “In Order 745, however, FERC went far beyond removing barriers to demand response resources. Instead of simply 'removing barriers,' the rule draws demand response resources into the market and then dictates the compensation providers of such resources must receive,” Judge Janice Rogers Brown wrote in the majority opinion. http://www.greentechmedia.com/articles/read/what-us-appeals-court-decision-on-ferc-order-745-means-for-demand-response
NERC Compliance Benchmarking Practices and Initiatives
Transmission Practice Questions 2014 Sections (by process) • Strategy • Operational • Regulatory • Asset Management • Transmission Operations Center (TOC) • Maintenance (including ROW) • Planning/Engineering/Design • T-line Field Construction Activities (including WMS and Contractor Productivity • NERC Compliance • Impact of CIP5 and the change from requirements to results-based regulation • Handling and structuring audits • Separate NERC audits for Critical Infrastructure and Reliability Standards • People fully-dedicated to the NERC compliance organization • Process changes implemented for Critical Infrastructure Protection [CIP] • Organization and staffing levels for Critical Infrastructure Protection [CIP] • Process changes implemented for Protection and Control [PRC] • Organization and staffing levels for Protection and Control [PRC] • Process changes for Facilities Design, Connections, and Maintenance [FAC] • Positions added for compliance with [FAC] • Future changes coming that will impact on transmission organization
IMPACT OF CIP5 AND THE CHANGE FROM REQUIREMENTS-BASED TO RESULTS-BASED REGULATION • TP165.1 • ID Response • 31 On November 22, 2013, FERC issued Order 791 approving CIPv5 with implementation scheduled for April 2016 for High and Medium Impact assets and April 2017 for Low Impact assets. With approval of CIPv5, FERC directed NERC to make several modifications. The modifications are still in development. Full impact of CIPv5 is yet to be determined. • 28 The result-based regulation enabled us to improve on the management of our centralized data repositories and expectations from the various Stakeholders who produce and/or use these critical data/information. • 33 Many more assets in scope because of the CIP5 requirements (approximately 200 additional assets) • 37 Changes for CIP5 do not have a finite date of implementation so there has been no impact as yet • 38 To date there has been minimal impact on the transition from CIP V3 to CIP V5. Although the V5 standards have been approved, NERC is tweaking language in the standards. Over the next year, we will begin the process of identifying BES (Bulk Electric System) Cyber Systems and updating processes/procedures in preparation for the standards to go into effect on April 1, 2016. • 40 Because the implementation date for CIP Version 5 is still far off, the impact has been relatively small so far. • 21 CIP V5 will have a substantial impact. The extent of which we are still evaluating. We have begun the transition to V5 and are implementing the necessary controls. • 30 Uncertain at this time • 27 CIP v5 has added additional facilities, monitoring & control, and demonstration of results. We are meeting these requirements by automating the change control process and spreading out the additional workload. • 359 1) For CIP V5, we have active projects underway in preparation for an April 2016 enforcement date. We are further along with the existing cyber assets in that we completed our assessments and initiated projects to address the necessary changes. For new cyber assets, we are currently assessing the impacts. 2) Our existing identify, assess and correct programs will effectively address one aspect of the Reliability Assurance Initiative (RAI). As for internal controls, we expect to improve our documentation to more effectively demonstrate our existing controls; as well as do a gap assessment for any new controls. • 32 CIP Version 5 is not in effect yet; impacts still under evaluation
HANDLING AND STRUCTURING NERC AUDITS PPL 359 Audits are coordinated by a central group (EU Compliance) within the Transmission organization. EU Compliance establishes a project plan/schedule to prepare for the audit. The plan includes gathering evidence; building evidence packages (bookmarked pdf files); coordinating with the regional Auditor on schedule, on -site logistics and data requests; subject matter expert (SME) orientation; audit dry runs for SMEs to practice evidence presentations; and a 3rd party review of evidence. • TP170.1 • ID Response • 31 Audit timing and scope are determined by the Reliability Entity. In 2012, Company audits for CIP and other Reliabiity Standards were scheduled by the Reliability Entity at the same time. • 28 1) Annual Self Certification Audit. Directed by the Utility Commission and managed by WECC. 2) 3 Years NERC Audi. On site audit review of evidence. • 33 Audits are coordinated by our NERC Compliance Department. • 37 The company has not been audited on CIP as yet • 38 Audits are performed on a 3 year cycle. Evidence for Audit Compliance is collected annually and stored in a document management system for easy of reference. Subject Matter Experts are prepared for testimony by performing mock interviews ahead of the audit by internal auditors and legal services. • 40 Operations groups coordinate with the Reliability Compliance Office to write RSAWs (Reliabiiity Standard Audit Worksheets) and gather evidence. • 21 All NERC related compliance and enforcement activities are handled by the NERC Compliance Group which resides in Regulatory Affairs. • 30 Audits are managed by an internal compliance organization. • 27 An internal compliance program describes how we handle audits. A coordinator facilitates all communication between the auditors and the Company. Teams of subject matter experts and standard owners prepare the material for the audit and answer questions posed by auditors during off -site or on-site interviews. • 32 SME's are assigned and responsible for every standard. SME's work with compliance analysts to ensure standards are met. NERC RSAWs are utilized where available. All evidence is packaged up and submitted by the Compliance Department. Request for information are answered by SMEs. *Not certain of what the question is asking, this question is decided by the regulator so the benchmarking of such is irrelevant to some extent. It would identify inconsistencies between regions).