Download
1 / 42
420 likes | 548 Views
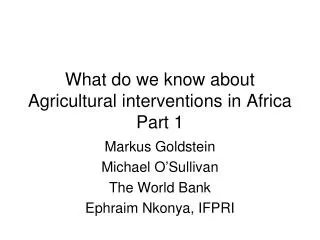
What do we know about Agricultural interventions in Africa. Markus Goldstein Michael O’Sullivan The World Bank Ephraim Nkonya, IFPRI. Cross-Country Workshop for Impact Evaluations in Agriculture and Community Driven Development Addis Ababa, April 13-16, 2009. We don’t know much.

E N D
What do we know about Agricultural interventions in Africa Markus Goldstein Michael O’Sullivan The World Bank Ephraim Nkonya, IFPRI • Cross-Country Workshop for Impact • Evaluations in Agriculture • and Community Driven DevelopmentAddis Ababa, April 13-16, 2009
We don’t know much • Scattered evaluations • Methods are often improvised ex-post, making it harder to show causal links or they are experiments to test a particular point rather than policy • Agricultural interventions are harder to evaluate than, e.g. health and education • More data intensive (crop/plot data, etc) • Interventions often multi-sectoral/multi-faceted • Infrastructure placement does not make finding a control group easy
But we can and should learn more • Imperative to evaluate agriculture given budgetary allocations and growing primacy of the sector given issues such as food/fuel prices • Thinking of methods before implementation can yield creative solutions (e.g. irrigation) • Sharp causal results = more budget (e.g. CCTs) • Use it to learn early in projects for dynamic learning • Increasing interest and innovative work – many of the papers I will talk about are quite recent
A quick tour of some of the evidence • Land tenure • Credit and insurance (and tech adoption) • Technology adoption/diversification • Extension • Infrastructure • Fertilizer • Demand driven advisory services
Impacts of Land Certification on Tenure Security, Investment and Land Markets: Evidence from Ethiopia (2008) Klaus Deininger, Daniel Ayalew Ali, Tekie Alemu
Intervention • National land certification program in Ethiopia • Registered more than 20 million parcels of rural land for approx. 6 million HH’s since 2003 • Inalienable use right certificates (not full titles) • Joint land ownership by spouses – with photos on certificates • Participatory land adjudication – managed by locally-elected committees; disputes resolved by elders • Low cost spatial measurement techniques – done in presence of neighbors • cheap to do – US$1/parcel or US$ 3.2 per hectare
Evaluation design • Delayed phase-in of land program (due to local capacity constraints) and four rounds of panel data (1999-2007) in the Amhara region difference in differences • Villages that received certificates at least one year earlier were compared with other villages • Measured differences between two groups to calculate the initial effects on: • perceived tenure security • land-related investment • land rental market participation
Main findings • Significant reductions in tenure insecurity: HH’s with certificates 9% less likely to expect decrease in land holdings and 14% less likely to expect increase • Strong effects on land investment: boosted soil & water conservation investments by 30% (equal to costs, easily in the first year) • Deep impacts on HH rental market participation: certificate HH’s 13% more likely to rent out land, and average amount rented out increased by 1/10 of a hectare • No impact on renting in of land (i.e., no change in demand for new land rentals)
Policy dimensions • Low-tech, transparent, systematic land policy can have large impacts • Community participation in land programs can improve likelihood of success • For effects to persist, need strong mechanisms for updating of records • Otherwise, benefits can be undermined as value of certificates diminishes
Insurance, Credit and Technology Adoption: Field Experimental Evidence from Malawi (2008) Xavier Giné, Dean Yang
Intervention • Level of rainfall is among biggest sources of production risk in Malawi • Field experiment provided credit and insurance to maize and groundnut farmers • Half the farmers were offered credit to purchase high-yield maize and groundnut seeds • Other half were offered credit for high-yield seeds with a required rainfall insurance policy • Insurance (priced at 6-10% of principal) partially or fully forgave loan in the event of low rainfall
Evaluation design • Measured impact of rainfall insurance on demand for hybrid seed loans • 32 farming groups of 10-20 members in randomly-selected locations • Farmers in 16 groups were offered group loans with rainfall insurance • Farmers in other 16 groups, offered uninsured loan, served as control group • Baseline and endline survey conducted
Main findings • Evidence suggests that farmers were less likely to accept a high-yield seed loan when attached to a rainfall insurance policy • 33% of farmers accepted standard loan without insurance. • Offering supplemental rainfall insurance led to 13 percentage point drop in the likelihood of taking out a hybrid seed loan • Farmers who accepted rainfall insured credit were more likely to have higher education, wealth and income levels • Farmers who accepted uninsured credit were less risk-averse
Policy dimensions • Poorer farmers may already receive implicit insurance through standard loans due to limited liability (lenders can only seize production under default) • Wealthier farmers may stand to lose more from loan default, and would prefer supplemental insurance • Rainfall insurance may be better for lenders – reduces default risk • Tough to design policies for insurance.
Finding Missing Markets (and a disturbing epilogue): Evidence from an Export Crop Adoption and Marketing Intervention in Kenya (2008) Nava Ashraf, Xavier Giné, Dean Karlan
Intervention • Provided credit, agricultural extension and export facilitation services to farmers in Central Kenya to adopt and market export crops (French beans and baby corn) • For-profit NGO facilitated farmer linkages with banks, farm input retailers, transporters, and exporters • Also provided training on EUREPGAP and Good Agricultural Practices • Response to export market constraints (credit, infrastructure, etc.)
Evaluation design • 36 registered farmer self-help groups were randomly selected into one of three groups: • 12: all program services • 12: all services except in-kind credit for inputs (seeds and fertilizer) • 12: no services (control group) • Baseline and endline survey of 750 individuals
Main findings • Farmers in program (with or without credit) were 19.2% more likely to grow export crops and had 4.3% more land devoted to cash crops • No overall impact on farm input usage, HH income or harvest value, but farmer marketing costs declined • But, new exporters benefited most: HH income grew by 31.9% (no impact for veteran exporters) • Surprisingly little difference in impact between the credit and non-credit groups • Program impacts did not persist: One year later, exporter stopped sourcing from farmers due to EUREPGAP non-compliance and program collapsed
Policy dimensions • Options exist to induce farmers to switch to export crops • Export market certification and requirements are critical to sustained program success • Credit might not be the binding export market constraint
The Impact of Agricultural Extension and Roads on Poverty and Consumption Growth in Fifteen Ethiopian Villages (2008) Stefan Dercon, Daniel O. Gilligan, John Hoddinott, Tassew Woldehanna
Intervention • Public investments may be critical enabling elements for agricultural growth • Agricultural extension services (e.g., advice on farming practices and new technologies) and rural road investments can be important public goods • Ethiopia substantially increased expenditures on agricultural extension training in 1997
Evaluation design • Five rounds of panel data from 15 Ethiopian villages from 1994 to 2004 • Measured impact of ag extension visits and access to all-weather roads on HH consumption and poverty • Relies on economic growth model and instrumental variables (number of adults and livestock and amount of fertile land) to identify impact • Findings not representative for all of Ethiopia
Main findings • One ag extension visit reduced poverty by 9.8% and increased consumption growth by 7.1% • Access to all-weather roads reduced HH poverty by 6.9% & raised consumption growth by 16.3% • Ag extension visits led to strong reductions in poverty for HH’s with less than 1 hectare (11.9%), w/heads 45 or younger (11.1%), and w/literate adult heads (14.3%) • All-weather roads benefited those with more assets: 15.2% drop in poverty for large land holders (with no effect on landholdings < 1 hectare), 9.1% drop for households in upper three quartiles of livestock holdings
Policy dimensions • Public investments in infrastructure and agricultural extension can raise average consumption growth and lift households out of poverty • Wealthier households may benefit more from rural roads investments
Nudging Farmers to Use Fertilizer: Evidence from Kenya (2009) Esther Duflo, Michael Kremer, Jonathan Robinson
Intervention • In earlier farm experiment, authors found that limited amount (1/2 teaspoon) of fertilizer as top dressing can generate 70% annual rates of return for maize • Low rates of fertilizer usage despite benefits – many farmers say it is too costly but not that it is unprofitable • Follow-on farm experiment to encourage fertilizer use and examine behavioral barriers to its adoption
Evaluation design • Farmers randomly selected into groups: • SAFI: small discount (free delivery) offered for planting or top dressing fertilizer just after harvest; farmer chose delivery date (seasons 1 & 2) • SAFI variant: Visit before harvest for opportunity to decide when to be visited again for free delivery discount • Reminder – visit at fertilization time and offered fertilizer purchase with free delivery • 50% subsidy and free delivery later during top dressing (1-2 months after planting) • Control group with none of the above
Main findings • SAFI discount pilot increased fertilizer use by 14.3 percentage points relative to controls in 1st season; 2nd season fertilizer usage increased by 21.3 percentage points (these are large relative to baseline of 29.7 percent fertilizer use) • Note that 38% of farmers accepted to buy • effects did not persist beyond SAFI season
Findings, cont. • SAFI variant: 26.3 percentage point increase in fertilizer usage relative to controls • note that 44% of farmers accepted to buy, more than in original SAFI • 50% subsidy led to a 13.2 percentage point increase in fertilizer use relative to controls • Reminder had no effect on fertilizer usage
Policy dimensions • Small, well-timed discounts can induce some farmers to purchase productive inputs • Time dimensions and farmer “impatience” may be important for technology adoption • Large, costly subsidies might not be appropriate policy response
Impact of demand-driven advisory services in Nigeria Nkonya, E., D. Phillip, T. Mogues, J. Pender and E. Kato. 2008
Intervention Fadama II offered demand-driven advisory services on agricultural production and other Fadama user group economic activities The project ran from 2004 – 2008 covering 12 states
Evaluation methods Collected panel data from 3756 households from both Fadama II beneficiaries and non-beneficiaries Propensity Score Matching (PSM) and Difference-in-Difference methods used to compute impacts of the project
Main results Fadama II project beneficiaries were less likely to demand for soil fertility technologies but were more likely to demand for post-harvest technologies Fadama II beneficiaries were more likely to practice irrigation than non-beneficiaries Income of beneficiaries increased by 59% but the increase was mainly among middle income beneficiaries
Impact of demand-driven agricultural advisory services in Uganda Benin, S., E. Nkonya, G. Okecho, J. Randramamony, E. Kato, G. Lubadde, M. Kyotalimwe & F. Byekwaso, 2008
Intervention Provide demand-driven advisory services on agriculture, through the National Agricultural Advisory Services (NAADS) Services provided through farmer groups. NAADS started in 2002 and covered all districts by late 2008
Methods Collected panel data (2004 and 2008). A panel of 719 households was collected Used matching methods, difference-in-difference and econometric methods to assess impact of NAADS
Main results Participation in NAADS increased income of beneficiaries by over 40% Adoption of production technologies and increase in crop area among beneficiaries was significantly higher than for non-NAADS BCA of NAADS investment was 5 Participation in NAADS increased the capacity of farmers to demand for production technologies but demand for post-production technologies was non-significant
Policy implications for CDD projects • Consistent with Mansuri and Rao, (2004), project orientation dictated the types of services demanded from supposedly “demand-driven” advisory services. • Fadama II project in Nigeria increased capacity to demand for post-production technologies • NAADS in Uganda increased the capacity of farmers to demand for production advisory services.
Policy implications Projects/programs need to be more flexible in their provision of advisory services in order to build a truly demand-driven advisory services Both Fadama II and NAADS increased agricultural income significantly suggesting the potential the approach for empowering the rural to manage development programs
So what do we know? • Some interesting things about a few programs in some areas in a few countries • But…evaluations to date often (but not always) are opportunistic not strategic and/or they are often methodologically challenged because they weren’t set up before hand • Need to shift to focusing on getting clear answers for projects and areas which are important and starting evaluations early