Download
1 / 23
310 likes | 752 Views
The El-Nino Southern Oscillation (ENSO). El Nino Impacts. La Nina Impacts. Outline. History Observed Structure and Evolution What Causes an El-Nino? ENSO Forecasting Global Impacts. ENSO. History In the 1600s, Peruvian fisherman noticed their fish harvests failed

E N D
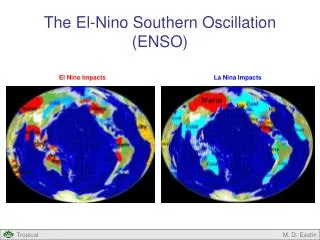
The El-Nino Southern Oscillation (ENSO) El Nino Impacts La Nina Impacts M. D. Eastin
Outline History Observed Structure and Evolution What Causes an El-Nino? ENSO Forecasting Global Impacts M. D. Eastin
ENSO • History • In the 1600s, Peruvian fisherman noticed their fish harvests failed • every few years due to warmer-than-normal waters (upwelling • provides nutrient-rich cold water for fish). The warming always • occurred in December, so the phenomena was named El Nino, in • reference to the Christ child. • In 1899 the Indian Monsoon failed, leading to severe drought and • famine. This lead Gilbert Walker, head of the Indian Met. Service, • to search for a way to predict the monsoon. He identified a peculiar • surface pressure oscillation: when the pressure is high over the • maritime continent (Indonesia and Darwin), surface pressures are • low over India and the central southern Pacific (Tahiti). He referred • to this as the Southern Oscillation. • In 1969, UCLA professor Jacob Bjerknes first recognized that El Nino • and the Southern Oscillation were actually manifestations of the same • physical phenomena that results from unstable interactions between the • ocean and atmosphere, and referred to it as ENSO • The 1982-83 El Nino event was the first to receive significant public • and research interest → a relatively new (not well understood) phenomena Sir Gilbert Walker Jacob Bjerknes M. D. Eastin
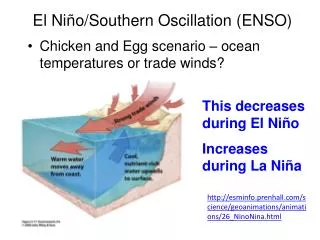
ENSO: Observed Structure • Normal Conditions or La Nina: • Strong easterly winds induce upwelling of cold water in the equatorial eastern Pacific • Shallow oceanic thermocline in the east Pacific (due to upwelling) • Warm SSTs confined to western Pacific with a deep thermocline • Low pressure and convection in west Pacific • High pressure and subsidence (clear air) in east Pacific M. D. Eastin
ENSO: Observed Structure • El-Nino Conditions: • Weaker easterly winds result in less upwelling of cold water • Warm SSTs “spread” to east Pacific (also solar heating not offset by upwelling) • Increase in the east Pacific thermocline • Low pressure and convection shifts to the east Pacific • High pressure and subsidence shifts to the west Pacific M. D. Eastin
ENSO: Observed Structure • ENSO Indices • Based on observed SST anomalies (difference from the long term mean) in the • equatorial Pacific in four regions (observation from TAO moored buoys) • Based on surface pressure differences between Tahiti and (minus) Darwin, called • the Southern Oscillation Index (SOI) Nino 3.4 Most highly correlated with eastward shift of convection Nino 3 Largest variability in SSTs over an average ENSO cycle Nino 4 Most highly correlated with global weather patterns Nino 1+2 Region that often first warms during the onset of an El Nino Darwin SOI Tahiti SOI Most highly correlated with Nino 3.4 SST M. D. Eastin
ENSO: Observed Structure • NOAA’s Multivariate ENSO Index (MEI) • Combines normalized anomalies of SST (in Nino3.4), surface pressures (the SOI), • surface winds, surface air temperatures, and cloud fraction to obtain a “composite” • view of the state of ENSO • Definitions:El Nino = Standardized Departures > +1.0 • La Nina = Standardized Departures < -1.0 82-83 97-98 El Nino La Nina 88 98-99 10-11 Source: http://www.cdc.noaa.gov/ENSO/enso.mei_index.html M. D. Eastin
ENSO: Observed Structure The 1995-1996 La-Nina Event January 1995 – December 1996 [Animation] M. D. Eastin
ENSO: Observed Structure The 1997-1998 El-Nino Event January 1997 – December 1998 [Animation] M. D. Eastin
What Causes El Nino? • Triggering Mechanism • Not well understood • Deep thermocline in the western Pacific believed to be a necessary (not sufficient) condition • “Westerly wind bursts” (WWBs) over a period of several days may be one trigger • Most often associated with the Madden-Julian Oscillation (MJO) • Atmospheric Kelvin waves also generate sustained westerly winds • Twin TC’s straddling the equator can also generate sustained westerly winds • Multiple sustained WWBs decrease the equatorial easterlies that induced cold upwelling • Less upwelling combined with a west-east ocean current (forced by the WWBs) • increases the central and eastern Pacific SSTs and lowers the thermocline depth • and initiates an El Nino event Anomalous surface winds (i.e. a WWB) associated with MJO convection (centered in the box) M. D. Eastin
What Causes El Nino? Onset of the 1997-98 El Nino Daily Mean Surface Values in the equatorial Pacific: 1 January 1997 thru 31 December 1998 Zonal Wind Anomalies (m/s) Mean Zonal Wind (m/s) SST Anomalies (ºC) Strong Easterlies WWB WWB Weaker Easterlies El Nino M. D. Eastin
What Causes El Nino? • An Oceanic Component • The WWBs acting alone would lead to a gradual eastward progression of SST anomalies • (which is observed but the signal is weak) • In contrast, observations show a pronounced rapid “emergence” of warm SST anomalies • in the equatorial east Pacific (along the Peruvian coast in the Nino1+2 region) • What causes this rapid emergence? • Delayed Oscillator Theory is one explanation for this rapid emergence • Atmospheric WWBs generate equatorial Rossby and Kelvin waves in the ocean • Oceanic waves propagate along the density contrast of the thermocline • Oceanic Rossby waves: Move westward at slow speeds • Induce upwelling (decreases the thermocline depth) • Effectively cool the ocean mixed layer and SSTs • Oceanic Kelvin waves: Move eastward very rapidly (much faster than Rossby waves) • Induce downwelling (increases the thermocline depth) • Effectively warm the ocean mixed layer and SSTs • This theory also provides an explanation for the ENSO oscillation every 4-5 years M. D. Eastin
What Causes El Nino? The Delayed Oscillator in a Simple Ocean Model Initial Time Thermocline Depth 25 days 100 days Forcing from single WWB Kelvin Wave reflects and becomes a Rossby wave 175 days 50 days Thermocline Depth Rossby Wave reflects becomes a Kelvin wave 225 days 75 days Upwelling Rossby Waves Downwelling Kelvin Wave Multiple reflections can lead to La Nina onset M. D. Eastin
What Causes La Nina? Onset of the 1998-99 La Nina Daily Mean Surface Values in the equatorial Pacific: 1 January 1997 thru 31 December 1998 Zonal Wind Anomalies (m/s) Mean Zonal Wind (m/s) SST Anomalies (ºC) Weaker Easterlies Lack of Strong WWB Lack of Strong WWB Strong Easterlies La Nina M. D. Eastin
ENSO: Global Impacts • Global Impacts • ENSO variability alters convection in tropical Pacific • This convective variability produces zonal anomalies in the Walker and Hadley Circulations, • which, in turn, influences mid-latitude synoptic-wave patterns and alters the global weather • Anomalous synoptic wave patterns lead to warmer/colder and wetter/drier conditions El Nino Impacts (Winter) La Nina Impacts (Winter) M. D. Eastin
ENSO: U.S. Impacts El Nino: Winter Temperatures El Nino: Summer Temperatures M. D. Eastin
ENSO: U.S. Impacts El Nino: Winter Rainfall El Nino: Summer Rainfall M. D. Eastin
ENSO: U.S. Impacts La Nina: Winter Temperatures La Nina: Summer Temperatures M. D. Eastin
ENSO: U.S. Impacts La Nina: Winter Rainfall La Nina: Summer Rainfall M. D. Eastin
ENSO Forecasting • Forecast Models • All models forecast SSTs in the equatorial Pacific (most often for the Nino3.4 region) • Statistical models • Employ simple multiple regression techniques based on ENSO indices • Based on evolution of previous ENSO events (and historical records) • Quality of forecasts reliant on quality of historical data • Cannot forecast “record” events • No physical interpretation possible • Dynamical Models • Most are complex coupled atmosphere-ocean models • Initialization requires 3-D observations of ocean and atmosphere (data sparse region) • Small scale features are parameterized • Can forecast record events (not bound by past events) M. D. Eastin
ENSO Forecasting Source: http://iri.columbia.edu/climate/ENSO/currentinfo/SST_table.html M. D. Eastin
The El-Nino Southern Oscillation (ENSO) • Summary: • History (basic timeline and rise to prominence) • Oceanic and atmospheric structure/flows during El Nino and La Nina • ENSO Indices (defining parameter, differences, and uses) • Causes of El Nino • Westerly Winds Bursts (definition, origin, impact/forcing) • Delayed Oscillator Theory (role of waves, explain rapid onset) • Global impacts of ENSO • Impact of ENSO in the U.S. • ENSO Forecasting (difference in model types) M. D. Eastin
References Climate Diagnostic Center’s (CDCs) Interactive Plotting and Analysis Webage ( http://www.cdc.noaa.gov/cgi-bin/PublicData/getpage.pl ) Kindle, J. C. , and P. A. Phoebus, 1995: The ocean response to perational westerly wind bursts during the 1991-1992 El Nino. J. Geophysical. Res., 100, 4893-4920. Knaff, J. A., and C. W. Landsea, 1997: An El Nino-Southern Oscillation Climatology and Persistence (CLIPER) Forecasting Scheme. Wea. Forecasting, 12, 633-652. McPhaden, M. J., 2004: Evolution of the 2002/3 El Nino. Bull. Amer. Meteor. Soc., 85, 677-695. M. D. Eastin