Download
1 / 47
470 likes | 604 Views
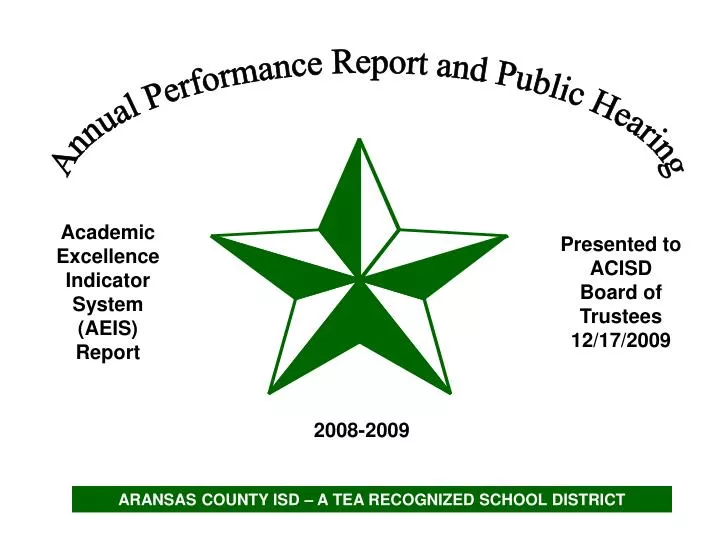
Annual Performance Report and Public Hearing. Academic Excellence Indicator System (AEIS) Report. Presented to ACISD Board of Trustees 12/17/2009. 2008-2009. ARANSAS COUNTY ISD – A TEA RECOGNIZED SCHOOL DISTRICT. Annual Performance Report. Texas Education Code requires Board to…

E N D
Annual Performance Report and Public Hearing Academic Excellence Indicator System (AEIS) Report Presented to ACISD Board of Trustees 12/17/2009 2008-2009 ARANSAS COUNTY ISD – A TEA RECOGNIZED SCHOOL DISTRICT
Annual Performance Report • Texas Education Code requires Board to… • Annually publish a report that includes the AEIS report, goals/objectives, violence citations/complaints, and THECB report. • Hold a hearing for public discussion of the report. • Widely disseminate the report within the district.
Annual Performance Report Contents • AEIS Guidelines • AEIS Glossary • AEIS District Report • AEIS Campus Reports & Comparable Improvement Reports • District/Campus Goals & Objectives • ACISD Violence Citations/Complaints • THECB Report • Annual Performance Report Board Presentation
TAKS Indicators Grade 3 2008-2009
TAKS Indicators Grade 3 2006-2009 Longitudinal Data
TAKS Indicators Grade4 2008-2009
TAKS Indicators Grade 4 2006-2009 Longitudinal Data
TAKS IndicatorsGrade 52008-2009*Science includes TAKS Accommodated
TAKS IndicatorsGrade 5 2006-2009 Longitudinal Data *Science includes TAKS Accommodated
TAKS IndicatorsGrade 6 2008-2009
TAKS IndicatorsGrade 6 2006-2009 Longitudinal Data
TAKS IndicatorsGrade 7 2008-2009
TAKS IndicatorsGrade 7 2006-2009 Longitudinal Data
TAKS IndicatorsGrade 82008-2009*Science & Social Studies include TAKS Accommodated
TAKS IndicatorsGrade 82006-2009 Longitudinal Data*Science & Social Studies include TAKS Accommodated
TAKS IndicatorsGrade 9 2008-2009
TAKS IndicatorsGrade 9 2006-2009 Longitudinal Data
TAKS IndicatorsGrade 102008-2009*Science & Social Studies include TAKS Accommodated
TAKS IndicatorsGrade 102006-2009 Longitudinal Data*Science & Social Studies include TAKS Accommodated
TAKS IndicatorsGrade 112008-2009*Includes TAKS Accommodated for all subjects
TAKS IndicatorsGrade 112006-2009 Longitudinal DataResults include TAKS Accommodated for all subjects
State Average ACISD Percentage TAKS % Met Standard 2008-2009 (Sum of All Grades Tested, including selected TAKS Accommodated) This indicator utilizes all the TAKS data for all student performance, including those students in Special Education, to calculate the percent of students in the DISTRICT meeting the standard.
TAKS % Met Standard(Sum of All Grades Tested, including selected TAKS Accommodated) 2006-2009 Longitudinal Data This indicator utilizes all the TAKS data for all student performance, including those students in Special Education, to calculate the percent of students in the DISTRICT meeting the standard.
New Indicator:TAKS % Met Standard with Texas Projection Measure • The Texas Projection Measure (TPM) is a score derived from statistically analyzing individual student scores and school-level TAKS scores. • TPM is used to predict whether or not the student will pass TAKS at the next “high stakes” grade level (5th, 8th, and 11th). • TPM is used in state and federal accountability.
State Average ACISD Percentage 2009 TAKS % Met Standard with Texas Projection Measure(Sum of All Grades Tested, including selected TAKS Accommodated) This indicator utilizes all the TAKS data for all student performance, including some of those students in Special Education, to calculate the percent of students in the DISTRICT meeting the standard including those who are projected to meet the standard at the next high stakes level.
ACISD Met Standard ACISD Met Standard with TPM 2009 Comparison of ACISD Met Standard and Met Standard with TPM(Sum of All Grades Tested, including selected TAKS Accommodated)
State Average ACISD Percentage TAKS % Commended Performance(Sum of All Grades Tested INCLUDING Selected TAKS Accommodated) This indicator utilizes all the TAKS data to calculate the percent of students achieving the highest level of performance and showing a thorough understanding of the knowledge and skills at the grade level tested.
TAKS % Commended Performance (Sum of All Grades Tested INCLUDING Selected TAKS Accommodated) 2006-2009 Longitudinal data
State Average ACISD Percentage TAKS-M % Met Standard – Sum of All Grades Tested(Report only item – Will become part of accountability system in 2011)
State Average ACISD Percentage TAKS % Met Standard - 2010 Preview (Sum of All Grades Tested, INCLUDING ALL TAKS ACCOMMODATED) This indicator utilizes all the TAKS data for all student performance, including those students in Special Education, to calculate the percent of students in the DISTRICT meeting the standard.
State Average ACISD Percentage 2009 TAKS Participation (Sum of Grades 3-11) Not tested = Absent, LEP Exempt, or Other
State Average ACISD Percentage Progress of Prior Year TAKS Failers(Sum of Grades 4-11, including TAKS Accommodated for grade 11) This indicator shows the percent of students who failed TAKS the prior year but passed the corresponding assessment in the current year. Comparison of 2007- 2008 and 2008- 2009 school years .
State Average ACISD Percentage Student Success Initiative Grades 3, 5, and 8 TAKS Cumulative Met Standard: Cumulative percent of students who took and passed the grade 3 TAKS reading test, grade 5 reading and mathematics tests, and grade 8 reading and math test across the March and April test administrations. .
State Average ACISD Percentage Attendance Rate Grades 1-12 This indicator shows the attendance rate for grades 1-12 for the 2005-2006, 2006-2007, and 2007-2008 school years.
State Average ACISD Percentage Annual Dropout RateGrades 7-8 (Standard Accountability Indicator) This indicator shows the dropout rate for grades 7-8 for the 2005-2006, 2006-2007, and 2007-2008 school years.
Completion/Student Status Rate • Grades 9-12: Class of 2007 and Class of 2008 • This indicator displays the status of the students expected to graduate with the class of • 2007 who first attended ninth grade in the 2003-2004 school year • 2008 who first attended ninth grade in the 2004-2005 school year
State Average ACISD Percentage Completion Rate I - without GED Grades 9-12 – Standard Accountability Indicator This indicator sums the percent of students in the cohort who graduated within four year or continued high school in the fifth year.
State Average ACISD Percentage Advanced Courses/Dual Enrollment Completion Grades 9-12 This indicator is based on a count of students who complete and receive credit for at least one advanced course in grades 9-12. Advanced courses include dual enrollmentcourses.
State Average ACISD Percentage RHSP/DAP Graduates Classes of 2006, 2007, and 2008 This indicator shows the percentage of graduates who were reported as having satisfied the course requirements for the Texas State Board of Education Recommended High school Program or Distinguished Achievement Program.
State Average ACISD Percentage AP/IB Results Grades 11-12 This indicator addresses students who participated in the College Board Advanced Placement (AP) examinations.
State Average ACISD Percentage SAT/ACT Results Classes of 2006, 2007, and 2008 This indicator describes student participation and performance on the SAT & ACT.
Other items of interest… • 60.6% of our students are economically disadvantaged, compared to the state with 56.7%. • We are above state average on teachers with graduate degrees. • 50.4% of our teachers have 11 or more years of experience, compared to the state at 42.3%. • 75% of our teachers are female. • 11.5% of our teachers are ethnic minorities. • Our total tax rate is $1.085 compared to the state average of $1.209.
Teacher Turnover Rate • AEIS turnover rate is the percent of teachers from fall 2007 who were not employed as teachers by the district in fall 2008 • Our turnover rate dropped from 21.7% to 16.5%, or 41 teachers out of 243.9 total. • 5 left to go into more lucrative non-teaching fields • 4 retired • 2 left due to ill health • 3 had babies and stayed home • 3 moved to a district closer to home citing gas prices • 7 moved out of the area for personal reasons (marriage, divorce, spouse transferred, housing) • 7 resigned in lieu of termination • 8 went to another school district “for a better job” • 1 became an administrator in ACISD
Comparable Improvement Reports • Included for RFHS, RFMS, & FLC • Compare students achievement growth as measured by the TGI (Texas Growth Index) to 40 demographically similar campuses • Goal is to be in “Q1” – the top Quartile • Comparable Improvement Gold Performance Acknowledgements are based on this report
Report on Criminal Incidents • Summary of district policies and practices • ACISD Violence Citations/Complaints • Selected results of PRIDE survey – April 06 & April 09
THECB Report • The Texas Higher Education Coordinating Board reports the number of Rockport Fulton High School students from the graduating class of 2008 who enrolled in a Texas post-secondary institution during the first year after graduation. • According to this report, 45% of RFHS 2008 graduates enrolled in a Texas post-secondary institution during the first year after graduation, as compared to 42% for the class of 2007. • Records kept by the high school registrar indicate that another 7% of the class of 2008 enlisted in the military. • New this year is a report summarizing first year college GPA information for the class of 2007.