Download
1 / 10
100 likes | 118 Views
This report evaluates support policy developments in OECD countries, comparing trends over time and across commodities, focusing on the 2003-2005 period relative to 1986-88. It analyzes the Producer Support Estimate (PSE), market orientations, and differences in support levels among countries. The report also examines the impact of policy objectives, historical instrument uses, and reform progress on support composition. Cross-commodity comparisons highlight influences such as currency depreciation and price changes in commodities like cereals, oilseeds, sugar, dairy, and meats. The analysis also addresses animal health issues affecting meat prices globally.

E N D
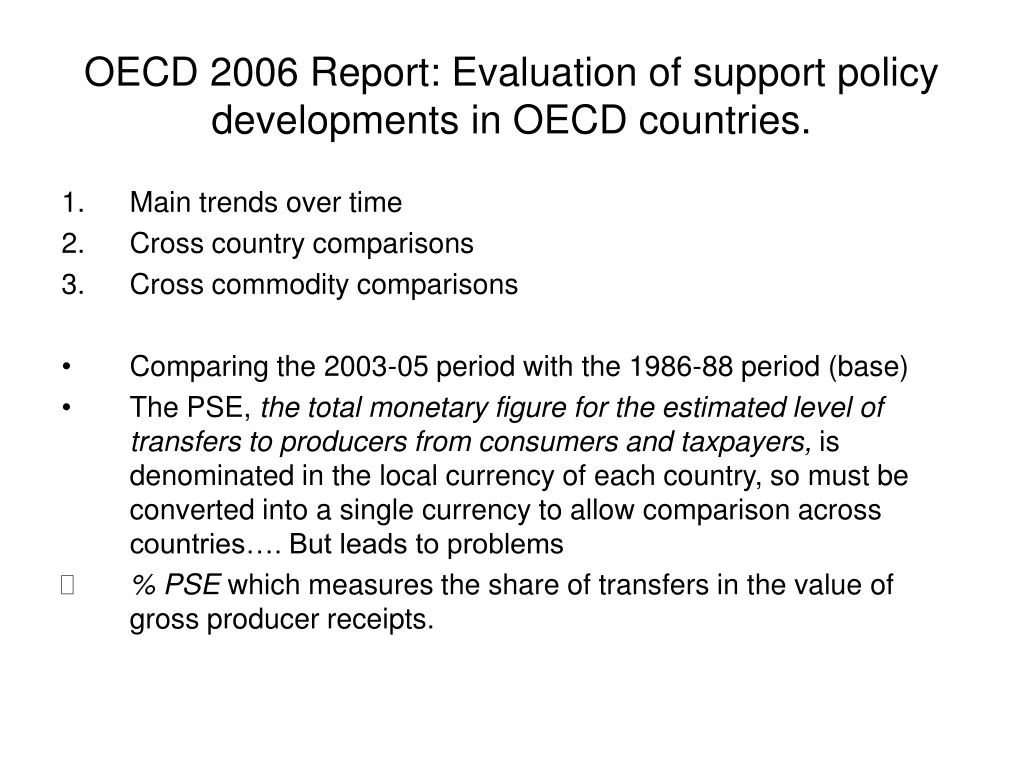
OECD 2006 Report: Evaluation of support policy developments in OECD countries. • Main trends over time • Cross country comparisons • Cross commodity comparisons • Comparing the 2003-05 period with the 1986-88 period (base) • The PSE, the total monetary figure for the estimated level of transfers to producers from consumers and taxpayers, is denominated in the local currency of each country, so must be converted into a single currency to allow comparison across countries…. But leads to problems • % PSE which measures the share of transfers in the value of gross producer receipts.
1.Overall support to producers over the long term. • Gradual and unsteady reduction.
Table 1.2: PSE fell from 37% in base to 30% in 2003-2005. NAC (Nominal Assistance Coefficient – an expression of the monetary value of transfers from consumers and taxpayers to producers relative to current production valued at the border price) indicates that while in 1986-88 farm receipts were on average 60% higher than they would be if entirely generated in world markets without any support, by 2003-05 they had fallen to 42% above their world market value. Result: Improvement in market orientation – with a greater share of farm receipts generated in markets than created by government intervention which is one of the principles set out in 1987 when the OECD decided to reform agricultural policy.
2.Differences in support across countries • Looking at %PSE: • 2005: • Increase – Iceland, Mexico, New Zealand (but Marginal • Decrease – E.U, Japan, Norway • Same – Australia, Canada, U.S, Korea, Turkey, Switzerland Why? Changes in the Market Price Support (MPS) & changes in budgetary support. Examples. • Over time: • Average %PSE in 2003-05 was lower than 1986-88 average in all countries except Turkey. • Largest relative decreases were in New Zealand, Mexico, Canada, Australia and U.S.
Large differences in estimated support among countries: • Below 5% in Australia & New Zealand • Less than 20% in Mexico & U.S • E.U higher than OECD average of 34% • Iceland, Japan, Korea, Norway & Switzerland greater than 50%, approaching 70% in some cases. BUT WHY??...... • Variations in policy objectives • Different historical uses of policy instruments • Varying pace & degree of progress in agricultural policy reform.
Composition of support across countries • Output linked support measures • Payments tied to purchased inputs. Bad because they distort production & trade and limit the extent to which world markets influence domestic production decisions. • But the OECD have changed the composition towards budgetary payments. • 1 & 2 above & share of MPS has decreased from 91% of overall OECD support to producers in 1986-88 to 72% in 2003-05(fig 1.4&1.5) • However this figure is averaged among all OECD countries so it still accounts for more than the 91% in Japan & Korea.
3.Cross commodity comparisons • Influenced by : depreciation in USD, Euro & Yen relative to other OECD currencies • Dollar – dominated commodity prices in 2005 changed little from 2004 but nominal prices are higher in 2003-05 than in 1986-88. • Cereal: rice increased, maize decreased, wheat stayed same but still higher than in base. • Oilseed: Decreased but still higher than in base • Raw Sugar: increased – 25% higher than in base. • Traded Dairy: increased – Milk 75% higher than in base. • Beef & Pork: increased in 2005 relative to 2004. but many other meat prices changed or fell. Why? • Animal diseases & health issues – BSE: Japan, Canada & U.S Avian influenza: Turkey& E.U FMD: Latin America