Download
1 / 44
440 likes | 577 Views
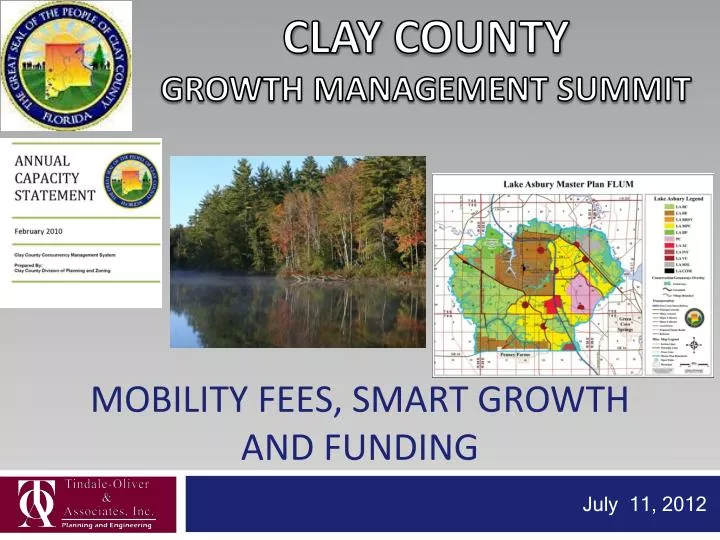
Clay County Growth Management Summit. Mobility Fees, smart growth and Funding. July 11, 2012. Presentation Overview. What is the reason? Key concepts Initiatives Around the State Wrap-up. What is the reason?. 3. Change Is there a reason? Can we get community buy-in?

E N D
Clay County Growth Management Summit Mobility Fees, smart growth and Funding July 11, 2012
Presentation Overview • What is the reason? • Key concepts • Initiatives Around the State • Wrap-up
What is the reason? 3 • Change • Is there a reason? • Can we get community buy-in? • Do we have the political desire?
What is the reason? 4 • What is Clay County’s Reason for Change? • Jobs • Economy • Funding • Tax Base
Presentation Overview • What is the reason? • Key concepts • Initiatives Around the State • Wrap-up
Key Concepts 6 • Spending flexibility • Creating development incentive tools • Getting the right development form and location • Creating new jobs • Multiple revenue sources • Optimizing revenues • per unit of land use
Presentation Overview • What is the reason? • Key concepts • Initiatives Around the State • Wrap-up
Initiatives Around the State 8 City of Jacksonville City of Destin Panama City Alachua City of DeLand City of Oviedo Orange City of Orlando Pasco • Mobility Fees and Plans Osceola City of Tampa = TOA Working On Plant City = TOA Monitoring City of Sarasota City of North Port City of Aventura Collier
Initiatives Around the State 9 • Selected Projects • Pasco County • City of Tampa • Osceola County • City of Orlando
Pasco County Mobility Fee 10 Reason for change… …Did not want to continue to be a bedroom community for Hillsborough and Pinellas counties.
Pasco County Mobility Fee 11 • Factors Motivating Pasco: • 48% of Pasco County workers employed outside of Pasco County boundaries – Highest % of commuters in Region • 12% Unemployment – Highest % in Region
Pasco County Mobility Fee 12 • Factors Motivating Pasco (Continued): • Highest impact fees in Region • Unsustainable Growth Patterns • Tax Base dependent on residential development (79%)
Pasco County Mobility Fee 13 • Study Completed
Pasco County Mobility Fee 14 “The whole point of the new fees is to do two things: create jobs and redirect growth in a way that’s healthier for the County. …. The idea is to keep the growth in the urban areas, keeping rural areas rural” John Hagen, President and CEO of the Pasco Economic Development Council
Pasco County Mobility Fee 15 • County Objectives: • Vary fees geographically • Incentives for job creating land uses • Flexibility to spend fees across modes • Other revenues subsidize incentives
Pasco County Mobility Fee 16 • County Objectives Continued: • Tolerate greater congestion in urban area • Penny for Pasco to be reauthorized in 2014 • Expand transit service • Earmark funds for state roads • Opt in provision for cities
Pasco County Mobility Fee 17 • County Objectives Continued: • Other revenues subsidize/buy-down fees • Gas Tax • Penny for Pasco Sales Tax • New Tax Increment (1/3 of growth county-wide) • Required buy-down calculated yearly based on permit issuance
Pasco County Mobility Fee 18 Vary Rate Schedules Geographically Rural Suburban Urban
Pasco County Mobility Fee 19 Vary Land Use Rate by Geographic Area Traditional Office Fee Per 1000 SF Old Fee = $3,703 $2,000 $1,000 $0
Pasco County Mobility Fee 20 Vary Land Use Rate by Geographic Area TND Office Per 1000 SF Old Fee = $3,703 $2,000 $500 $1,000 $250 $0
Pasco County Mobility Fee 21 No Fee for TOA in Targeted Overlay Areas TOD All Uses Per 1000 SF Old Fee = N/A N/A N/A $0
Pasco County Mobility Fee 22 • Summary: • Implement comprehensive plan • Economic development incentive tool • New jobs in Pasco County • Right development form, right place, right time • Now updating the Land Development Code
Initiatives Around the State 23 • Selected Projects • Pasco County • City of Tampa • Osceola County • City of Orlando
City of Tampa 24 Reason for change… …Wanted to provide a flexible and expedited review process to guide growth and development into targeted areas while protecting neighborhoods and single-use areas.
City of Tampa Protected Areas • Stringent Review Requirements • Must Meet Concurrency Strategic Vision Protected Neighborhoods
City of Tampa • Targeted Growth Districts • Pay-and-Go • Expedited Review Requirements Strategic Vision Redevelopment Districts Westshore DRIs Downtown CRAs Pay and Go
City of Tampa Targeted Growth Districts • Pay-and-Go • Expedited Review Requirements Strategic Vision Bus Rapid Transit Corridors Streetcar Service Area Transit Centers Bus Transfer Centers Pay & Go
Initiatives Around the State 28 • Selected Projects • Pasco County • City of Tampa • Osceola County • City of Orlando
Osceola County Transportation Funding Study 29 • Reasons for change… • Roadway conditions worsening • Wanted county-wide transportation system that carried out County conceptual master plans with a long-term capital and operating funding plan
Osceola County Transportation Funding Study 31 • BCC Direction (Four Workshops): • Improve maintenance conditions • Eliminate transportation impact fees • No new taxes; think out of the box first • Equity and fairness between who pays • Enhance current maintenance funding • Rebalance projects with existing revenues • Must have implementation action plan
Osceola County Transportation Funding Study Implementation considerations • Develop legal framework and issues for new growth and existing base DAT ordinances • Define issues and develop ordinance to repeal transportation impact fee ordinance • Define any other issues relating to BCC direction on transportation funding • Coordinate with cities • Update Comprehensive Plan and Code
Presentation Overview • What is the reason? • Key concepts • Initiatives Around the State • Wrap-up
Wrap-up 35 • Spending flexibility (Pasco and Orlando) • Creating development incentive tools (Pasco and Orlando) • Getting the right development form and location (Pasco, Orlando, Tampa, Osceola) • Creating new jobs (Pasco, Orlando, Osceola) • Multiple revenue sources (Pasco and Osceola) • Optimizing revenues per unit of land use (Orlando and Osceola)
Thank You ! • Bob Wallace, P.E., AICP • Tindale-Oliver & Associates • bwallace@tindaleoliver.com
Initiatives Around the State 37 • Selected Projects • Pasco County • City of Tampa • Osceola County • City of Orlando
City of Orlando 38 Reason for change… …Wanted flexibility to spend funds across alternative modes and incentives for mixed-use and transit-oriented development.
City of Orlando Multi-Modal Transportation Fee 39 • Key Concepts: • Flexibility to spend fees across modes • Incentives for transit oriented and mixed-use land uses • Existing revenues subsidize incentives
City of Orlando Multi-Modal Transportation Fee 40 Initial Planning Areas 1 2 3
City of Orlando Multi-Modal Transportation Fee 41 • Area 1B: • Annual Growth Rate (2010-2040): • Population = 0.36% • Employment = 0.49% • Area 1A: • Annual Growth Rate (2010-2040): • Population = 2.18% • Employment = 0.75% • Area 3: • Annual Growth Rate (2010-2040): • Population = 4.76% • Employment = 9.22% • Area 2: • Annual Growth Rate (2010-2040): • Population = 1.75% • Employment = 1.77%
City of Orlando Multi-Modal Transportation Fee Legend Mixed Use/TOD Smart Growth Application A2 A3 C2 C3 C1 A1
City of Orlando Multi-Modal Transportation Fee Property Tax Revenue per Acre A3 A2 C3 C2 C1 A1
City of Orlando Multi-Modal Transportation Fee Area 1 Area 3 City Avg. 1st Credit 2nd Credit Area 2 Currently Adopted Fee Rate