Download
1 / 16
170 likes | 418 Views
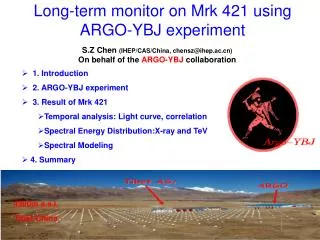
1. Introduction 2. ARGO-YBJ experiment 3. Result of Mrk 421 Temporal analysis: Light curve, correlation Spectral Energy Distribution :X-ray and TeV Spectral Modeling 4. Summary. Long-term monitor on Mrk 421 using ARGO-YBJ experiment. S.Z Chen (IHEP/CAS/China, chensz@ihep.ac.cn)

E N D
1. Introduction • 2. ARGO-YBJ experiment • 3. Result of Mrk 421 • Temporal analysis: Light curve, correlation • Spectral Energy Distribution:X-ray and TeV • Spectral Modeling • 4. Summary Long-term monitor on Mrk421 usingARGO-YBJ experiment S.Z Chen (IHEP/CAS/China, chensz@ihep.ac.cn) On behalf of the ARGO-YBJ collaboration 4300m a.s.l. Tibet/China
1. Introduction • Mrk 421 is the first extragalactic TeV source (Punch et al. 1992). BL Lac objects/Blazar/AGN. • Mrk 421 is a very active blazar, frequently outbursts accompanied by many short timescale flares. • A ideal target to study the emission mechanism in the jet. • Z = 0.031, low EBL absorption, • Models: leptonic (SSC) vs. hadronic origin? RXTE/ASM 2-12keV
General features support SSC model • Various timescale outburst, down to sub-hour scale; • Correlation of Multi-wavelength observation; • Challenges of SSC: • ”orphan flares”; • Lags of about two days; • One week lead (Blazejowski et al. 2005); • But they are of marginal significance due to discontinuous observations. • TeV observation • IACTs: good sensitivity, work on clear moonless nights . MAGIC, VERITAS, Whipple. • EAS arrays: long-term continuous monitoring. Tibet ASγ, Milagro (closed in 2008), ARGO-YBJ
2. ARGO-YBJ experiment 99 m 74 m Number of Fired Strips 8 Strips (6.5 x 62 cm2) for each Pad 10 Pads (56 x 62 cm2) for each RPC 1 CLUSTER = 12 RPC (43 m2) 78 m 111 m RPC 4300m a.s.l. Tibet/China Start from July 2006 Rate:3600Hz Threshold:~ 300 GeV Duty cycle: >85% FOV: 2 sr
Detector performance • The moon shadow from cosmic ray background is a stable deficit source and can be used to check the detector performance • Size of the deficit ⇒ angular resolution • Position ⇒ pointing accuracy • West displacement ⇒ Energy calibration • 10σ per month ⇒ monitor the detector stability Angular resolution West displacement
SED of Crab • Crab is a standard candle and can be used to test the reliability of the simulation procedure and the method to obtain SED. • The SED obtained by ARGO-YBJ is in agreement with other experiments Crab
3. Result of Mrk 421 • Data sample: • Nov. 2007 -- Feb.2010; • effective time: 676 days • The maximal significance obtained is 11.9 σ with an angular resolution of 0.7 degree. • Npad>60 + 45 • Successfully observation the flare in 3 days level; • Details in ApJL 714 (2010) L208.
outburst Accumulated Light Curve • Long-term variation feature could be clearly obtained from the accumulated light curve. The three lines in the figure are RXTE/ASM 2-12 keV, Swift/BAT15-50 keV and ARGO-YBJ TeV respectively. • The steepness of the curve stands for the flux. There is a large outburst in the beginning of year 2008. The source enters in active phase since the beginning of year 2009.
Differential light curve for the large outburst in 2008 • Npad>100, one point is the average result over 5 days. • There are four large flares and the peak times are in good agreement among three energy bands. Conclusion: There is a nice long-term correlation between X-ray and TeV.
Discrete correlation function (DCF) • DCFs (Edelson & Krolik 1988) are measured to quantify the degree of correlation and lags between X-ray and TeV. • The centroid of DCF distribution is obtained by fitting the range of(-10,10)using Gaussian function. • No significant lag is found and the upper limit for the cross-band lag is about 1 day. It contraries to the result obtained by Whipple that TeV lags behind X-ray 1.8±0.4 days (Blazejowski et al. 2005) Swift/BAT&ARGO-YBJ -0.647±0.614 RXTE/ASM&ARGO-YBJ 0.108±0.548
Spectral Energy Distribution • To study the SED in different flux levels, both the X-ray and TeV observation data are grouped into 4 bands based on the RXTE/ASM daily count rate: >5, 3~5, 2~3, 0~2 cm-2s-1。 • The X-ray spectra are obtained by fitting ASM three energy points based on the count rate:1.5~3, 3~5 and 5~12 keV. The X-ray spectra is consistent with previous result (Rebillot et al. 2006). • The X-ray spectra are harden towards high fluxes. The SED of X-ray
The SED of TeV • The optical depth given by Franceschini et al. (2008) is used to correct the EBL absorption. • The flux ranges from 7 to 0.9 Crab units. • The TeV spectral index is harden towards high fluxes. The relation between the flux and the spectral index generally follows the function presented by Krennrich et al. (2002).
TeV/X-ray flux variation relation • A positive correlation is observed • A quadratic fitting gives x2/nof=1.9/2; • A linear fitting gives x2/nof=7.7/2. • The relation appears quadratic rather than linear. Similar result has been reported by Fossati et al. (2008). While it contraries to the result obtained by Amenomori et al. (2003).
Spectral Modeling A one-zone SSC model proposed by Mastichiadis & Kirk (1997), also see Yang et al. (2008)
Summary • ARGO-YBJ has continuously monitored Mrk 421 TeV emission since Nov. 2007, and 2 year long-term simultaneous X-ray/TeV observation is achieved by combining ARGO-YBJ with X-ray satellite (Swift/BAT and RXTE/ASM). • Based on a long-term continuously observation, a more reliable X-ray/TeV correlation is observed and no lag above 1 day is found, which is consistent with the prediction of SSC model. • Both TeV and X-ray spectra are harden towards high fluxes. A SSC model is constructed to fit the multi-wavelength SED in 4 flux levels, and the fluxs in different levels are mainly caused by changing the maximal energy of the electron injection spectrum. • Conclusion: Both temporal and spectralanalysis results could be well interpreted in the framework of SSC model, and no challenging to this model is found.