Download
1 / 23
230 likes | 382 Views
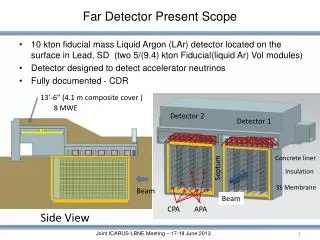
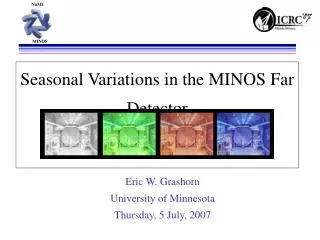
Eric W. Grashorn University of Minnesota Thursday, 5 July, 2007. Seasonal Variations in the MINOS Far Detector . Far Detector. 2341 ft (2100 m.w.e.) Scintillator and steel tracking calorimeter 486 octagonal planes 2 “Supermodules” 5.4 Kton 1.5 T magnet. Seasonal Variation.

E N D
Eric W. Grashorn University of Minnesota Thursday, 5 July, 2007 Seasonal Variations in the MINOS Far Detector
Far Detector • 2341 ft (2100 m.w.e.) • Scintillator and steel tracking calorimeter • 486 octagonal planes • 2 “Supermodules” • 5.4 Kton • 1.5 T magnet
Seasonal Variation • Underground experiments (Barrett, MACRO, AMANDA) reported positive correlation between muon intensity and atmospheric temperature • Correlation motivated by upper atmosphere density • Higher temp = lower density • Primary interactions take place higher in the atmosphere at higher temperatures • Thus, mesons are more likely to decay than interact
Temperature Coefficient • Determine aT experimentally (for pion only hypothesis): • Effective Temperature (Teff) treats the atmosphere as isothermal • Weighted average of uniform atmospheric levels
Muon Data Selection • Data from 08/03-08/06 • 1096 days of detector running (968 live-days) • 40.38 million CR events • Cuts: • Pre-analysis: DeMux FOM failures, “Bad run”, multiple muon, coil status • Data Quality cuts: Length <2, Nplanes <20, Fiducial cut, “fit quality” cut • 24.6 Million events survived, 60.9% of the data
Cosmic Ray Events • Time between consecutive events, log y • c2/ndof = 90.9/105 • Slope <Rm> = 0.287 Hz • Rate per day:
Temperature Data Selection • IGRA (Integrated Global Radiosonode Archive) data taken from International Falls, MN (150 Km NW of Soudan) • Cuts: • Two balloon flights, 1100 and 2300 (C.S.T.) • Column height > 60 g/cm2 • 128 days excluded • Error on Teff data was calculated by subtracting the rms from the mean.
Teff Distribution <Teff> over the three year period: 221.0 K
Deviation from Mean (%): • Left: DRm (top) DTeff (bottom) over three years • Right: DRm(DTeff) over the same three year period • Fit a straight line (error bars in both dimensions) • c2/ndof = 1420/953
Correlation • The temperature coefficient (aT) is the slope of the linear fit of DRm (DTeff). The MINOS result (pion only hypothesis): aT = 0.87 ± 0.03 • Correlation for these two distributions: 0.79
Theoretical aT • Calculate <aT > with a simple Monte Carlo: • Choose a random Em, cos(q) from the differential intensity spectrum, find random f, assume flat overburden to find X. • Use Em, cos(q) in aT calculation if Em > Eth . • Calculate aT (from Barrett) with 10,000 such successful muons at slant depths up to 4000 mwe.
Theoretical aT • Data: Barrett 1, 2 (Barrett, 1952), AMANDA (Bouchta et al, 1999), all other points from Ambrosio et al, 1997. • Curve is calculated aT (depth)
Charge Separated • Used qp/sqp > 2.2 • 11.86 Million events survive: • 6.74 million m+ • 5.12 million m- • Livetime: • 774 days forward • 192 days reverse Charge separated seasonal fluctuations as % diff from the mean; m+ in circles (top), m- in triangles (bottom). Reverse field
Charge Separated • Charge separated DRm (DTeff) • Correlation coefficient: • m+: 0.54; m- : 0.47. • aT: • m+: 0.84 +/- 0.05 • m-: 0.84 +/- 0.06
Conclusions • Temp Coefficient, aT, in MINOS: 0.87 +/- 0.03 • This precise measurement of a small signal ( +/- 4% fluctuations), shows MINOS’ sensitivity • Result is slightly below expectation • Charge Separated: • aT for m+: 0.84 +/- 0.05; aT for m-: 0.84 +/- 0.06 • Within error, these are identical; there is nothing new here (as expected).
Temperature Coefficient • Correlation between Im and T given by Barrett as: • Rewriting Im for a particle counter: • So, to determine aT experimentally:
Effective Temperature • In order to evaluate the integral, we use the “effective temperature” approximation of Barrett: where Lp= 160 g/cm2 ,LN = 120 g/cm2
Effective Temperature • We now have: • Which gives: *Note that Teff is for pion induced muons only
Cuts • Pre-analysis: • DeMux FOM failures, “Bad run”, multiple muon, coil status • Data Quality cuts: • Length >2, Nplanes > 20, Fiducial cut, “fit quality” cut • 24.6 Million events survived the cuts, 53.4% of the data
Cuts • Table of events that survive each cut:
Theoretical aT • For differential intensity distributions of the form: With g = 1.7, ep =139 GeV, ek = 860 GeV • Barrett gives: With Eth the threshold muon energy required to survive to slant depth X (mwe), given by Eth(q,f) = 0.5(TeV)(e0.4X -1)
Conclusions: • Binned by day, there seems to be a correlation between Rm & Teff for charge-separated events as well • aT for m+: 0.84 +/- 0.05; aT for m-: 0.84 +/- 0.06 • Within the error for each measurement, these are identical, so the charge separated sample doesn’t tell us anything new (this is good)