Download
1 / 26
280 likes | 483 Views
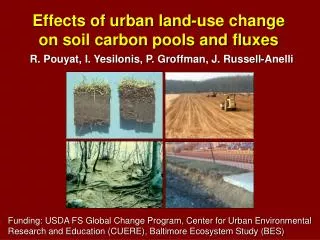
Effects of urban land-use change on soil carbon pools and fluxes. R. Pouyat, I. Yesilonis, P. Groffman, J. Russell-Anelli. Funding: USDA FS Global Change Program, Center for Urban Environmental Research and Education (CUERE), Baltimore Ecosystem Study (BES).

E N D
Effects of urban land-use change on soil carbon pools and fluxes R. Pouyat, I. Yesilonis, P. Groffman, J. Russell-Anelli Funding: USDA FS Global Change Program, Center for Urban Environmental Research and Education (CUERE), Baltimore Ecosystem Study (BES)
LAND USE CHANGE EFFECTS ON SOIL ORGANIC CARBON ? • NET EFFECTS? • RECOVERY?
URBAN SOIL MOSAIC SMALL PARCELS DIVERSE LAND OWNERS INTENSIVE MANAGEMENT HIGHLY DISTURBED & COVERED SOILS URBAN CLIMATE CHANGE/POLLUTANTS REMNANT PATCHES
SOIL DISTURBANCE EFFECTS? 1. SOIL PHYSICAL DISTURBANCES MIXING AND COMPACTION DISRUPTION OF SOIL AGGREGATES DRAINAGE 2. BURIAL AND COVERAGE OF SOIL LAND FILL IMPERVIOUS SURFACES REDUCED AERATION 3. LOSS OF SURFACE HORIZONS (EROSION)
175 170 165 160 1996 Profile 155 2002 Profile 150 145 0 50 100 150 200 250 Distance in Meters BALTIMORE COUNTY ? 2600 m2 TOP SOIL? DISTURBED SOIL SUB SOIL 2.7 x 10⁴ kg SOC McGuire (2004)
MADE SOIL ORGANIC C PEDON DATA MADE SOIL TYPE n C DENSITY(kg m-2) REFUSE 2 17.2 (±3.3) CLEAN FILL 8 2.8 (±1.0) DREDGE (RECENT) 1 24.7 DREDGE (OLD) 4 3.8 (±0.3) n = # of pits L. Hernandez, NRCS, NYC Soil Survey (NEW YORK CITY) D. Fanning, J.R. Short (WASHINGTON DC AND BALTIMORE)
BALTIMORE CITY 2.00 1.80 r = 0.52 P < 0.0001 1.60 1.40 1.20 Bulk Density (Mg m-3) 1.00 0.80 0.60 0-5 cm 0.40 n = 126 0.20 10 land-use types 0.00 0 2 4 6 8 10 12 14 SOM (%) Pouyat et al. 2001
MANAGEMENT/SITE HISTORY? Supplements Clipping Erosion Cultivation
MARYLAND, USA TURFGRASS MAINTENANCE COSTS (MANAGEMENT EFFORT VARIES!) COST PER ACRE (IN U.S. DOLLARS) LAND-USE TYPE GOLF COURSES 2,727 LAWN CARE FIRMS 1,969 ATHLETIC FIELDS 1,155 PARKS 450 DETACHED HOMES 369 CHURCHES 166
Lawn Carbon Densities n = 2 Recreational use/grass n = 4 Residential grass n = 6 Park use/grass 0 10 20 30 2 Carbon Density (Kg/m ) L. Hernandez, NRCS, NYC Soil Survey (NEW YORK CITY) H.K. Jo and E.G. McPhereson (CHICAGO) C.Y. Jim (HONG KONG) Stroganova et al. (MOSCOW)
Management/Cover • Site history From Qian and Follet (2002)
AGE SINCE DEVELOPMENT 12 10 8 Woody Vegetation C Carbon (kg m-2) Lawn Stubble C 6 SOC 0-10 cm 4 SOC 10-20 cm SOC 20-30 cm 2 Veg n=53 sites total (not all represented here) Soil n= 14 sites total 0 Grass- land 1990s AGRIC. 1950s 1960s 1970s 1980s Land Use or Decade of Development Golubiewski and Wessman, 2004, submitted Golubiewski and Wessman (2004, submitted)
BALTIMORE COUNTY 10.0 10.0 P = 0.09 1970 (n=11, lawns) 1980 (n=13, lawns) 7.5 7.5 0-5 cm SOM g/100g 5.0 5.0 2.5 2.5 0.0 0.0 OM pH Yesilonis, Pouyat, & Russell-Anelli
URBAN ENVIRONMENTAL CHANGE • 1. Altered temperature regimes • 2. Introduction of pollutants • - Toxic and sub lethal effects • - “Fertilization” (CO2, N deposition) • 3. Introduction of non-natives • - Litter quality • - Keystone species (earthworms) • 4. Altered hydrologic processes
RESPONSE ALONG URBAN-RURAL GRADIENT IN NEW YORK CITY URBAN RURAL URBAN RURAL Soil Pb, Cu, Ni Soil Ca, Mg,Total salts Soil Temperature N, S, Ca, Mg deposition Exotic Earthworms/Mull Fungi Microinverts Mor soils Litter quality Pouyat et al 1995
SOIL C POOLS (0-15 cm) PoolUrbanRural mg g-1 Readily Mineralizable2.1 (0.5)7.4 (3.3) Labile (microbial)6.9 (1.3)20.9 (2.6) Potentially Mineralizable4.7 (0.5)6.8 (0.5) Passive (total)97 (3.3)73 (4.3) Groffman et al. (1995)
? Remnant soils? p Data in Pouyat et al. 2003
Net Change SOC in Hypothetical 1000 ha Urban Landscape Pre-Agriculture Pre-Urban (Ag) Urban kg C 4.17 x 10⁻⁶ 2.59 x 10⁻⁶ 2.36 (?) x 10-6 6.31 x 10⁻⁶ 6.26 x 10⁻⁶ 5.06 x 10⁻⁶ Mid-Atlantic Southeast Southwest 11.56* x 10-6 7.74 x 10⁻⁶ 1.4 x 10⁻⁶ *soil organic carbon density to 1 m depth (kg C m-2); data for forest and crop SOC from Birdsey (1992) Land-use and impervious cover data for 58 cities USA (Nowak et al., 1996)
BALTIMORE CITY n = # plots (3 cores/plot) N n Pouyat, Yesilonis and Russell-Anelli
Ecotope Mapping Historic Air Photos Stratify Samples Change Analysis E. Ellis
CONCLUSIONS • SOC pools vary widely in urban mosaic • 2. Management & use affect SOC pools • SOC pools: disturbances ↓, management ↑ • Net effects depend on prevailing climate • 3. Urban environmental effects less important (pools/quality?), potentially more widespread • 4. Permanence of urban land-use conversions has long-term implications (net gain or loss). • 5. Uncertainties (spatial variation, C density measurements, covered soils, site history)