Download
1 / 20
200 likes | 338 Views
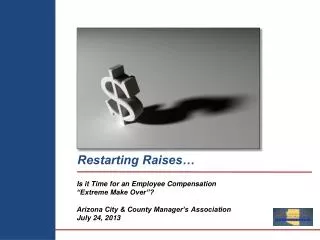
Senior Faculty Raises. First Year Results. Context . 1986-2006: 7 years in which UW received no legislative appropriations for salary adjustments 1986-2000: 5 years in which UW salary adjustment were 3% or less

E N D
Senior Faculty Raises First Year Results
Context • 1986-2006: 7 years in which UW received no legislative appropriations for salary adjustments • 1986-2000: 5 years in which UW salary adjustment were 3% or less • 2001-2006: Larger adjustments occurred in 2001 (8.1%), 2003 (12.4%), and 2005 (6.2%) • 2006: Governor requested raises for all state employees in FY 2007 and FY 2008, averaging 3.5%/year.
Consequences • Salaries of employees hired in the 80’s and into the 90’s have not kept pace with the market • Until recently, salaries of retiring faculty had grown too slowly to fully fund the salaries of their replacements, even at the entry level • UW lost faculty positions, and the structure of the academic workforce changed to include a somewhat higher proportion of academic professionals.
Request to 2006 Legislature: • The Governor requested raises averaging 3.5%/year for all state employees. • To “retain top performing senior faculty” UW asked for $3.9M “on top of proposed funding for salary increases for the upcoming biennium.” • Justification: “Despite substantial funding for salary increases in recent years, senior faculty salaries still lag significantly behind national market levels for land grant universities like UW. Even including the proposed funding for salary increases for the upcoming biennium, some 213 UW senior faculty members will have salaries that remain an average of 7% below the national average for land-grant universities.” • The amount requested included estimates for associated benefits.
2007-2008 Authorizations • $26.4 Million = Enough to fund raises for all UW employees, averaging 3.5% for each year of the biennium • $2.96 Million = Enough “[f]or additional salary increases over the biennium, thus phasing in the request over the two year period.” Didn’t get enough to fund all of the senior faculty raises in 1 year; got enough to distribute the raises in 2 installments (FY 2007, FY 2008).
Amounts available for distribution in senior raises $987K for raises and associated benefits in FY07 $987K to sustain first-year raises and benefits in FY08 $987K for raises and associated benefits in FY08 $2.96M total for 2007-8 biennium Breakdown of annual amount: $830K for salary increases $157K (19%) for benefits (e.g. retirement) $987K total
Distribution Principles • Premise: the raise should be targeted toward top-performing senior faculty • To avoid smearing out the effect of the raise, we administered it after the general raise and established an eligibility floor. • Criteria: • Seniority • Merit • Market • Equity
Defining “Seniority”: Average Market Difference, Associate + Full Professors
Eligibility and Criteria • Seniority: UW start date of 1996 and earlier • Administrators (= deans & higher) not eligible • Merit: General raise of at least 2.5% from college • Promote and preserve equity, especially for women and people of color • Salary significantly different from relevant market comparator (deans didn’t have to use OSU averages) • Other compelling justification
Process • Begin after completing general raise process, to ensure special raise targets senior faculty • Early July: circulate data set containing • salaries (before and after general raise), • OSU comparator salaries, if we knew them • service dates, ranks, gender and ethnicity • Provide dollar “targets” for college raise requests • July-August: • initial college nominations, • AA feedback, • final college nominations • September: raises appear in paychecks
Outcomes • 322 senior raises distributed • 260 senior faculty members (professor series, plus a few library faculty, and archivists) received $715,512 • 62 senior extended-term academic professionals (lecturers, extension educators, research scientists) received $114,480 • Average senior raise was $2,578 • Range was broad: $492 - $7,200 • Different deans approached the raise differently
Did we achieve our goal? • Compared to the 2004-2005 baseline, the salary gap for full professors narrowed from 14% to 7% • Salaries of faculty included in special raise pool rose more than the market • Average increase for senior raise pool was 6.8% • Full professor salaries at LGU’s rose 4% from AY2005 to AY2006 • But gap persists for professors • We suspect it’s still a problem for APs, but the OSU data don’t include this category
What’s ahead? • There is another 3.5% (average) general raise to administer for 2008 • There is another $830K to distribute in special senior raises in 2008 • Options include: • Distributing according to the same rules • Including only senior-ranked faculty • Including only full professors • Others?
First 2 months of the $987K in FY 2007: $165K in one-time monies
Faculty rank and gender equity: 20 of the 56 associate/assistant profs who received raises are women (36%) 30 of the 188 full profs are women (16%) How much difference did the inclusion of APs make to faculty? Amount distributed to APs: $114,480 Number of faculty members who received senior raises: 260 $114,480 / 260 = $440.30 per year