Download
1 / 9
90 likes | 223 Views
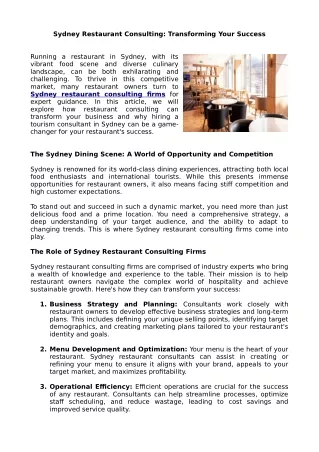
This analysis delves into the dynamics of the Sydney restaurant industry, emphasizing the power of visualizations in conveying complex data and enhancing understanding. Image-based texts allow for more accessible consumption of critical information regarding potential clientele, competition, and market density. It highlights the importance of framing in analysis, quoting Anne Friedberg, and provides key metrics like average household income and restaurant pricing in Sydney's varied demographic landscape. A resourceful guide for future restaurateurs and industry analysts alike.

E N D
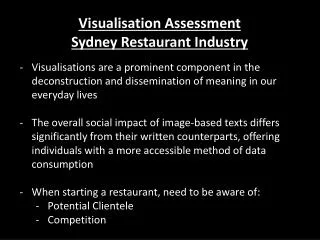
Visualisation Assessment Sydney Restaurant Industry • Visualisations are a prominent component in the deconstruction and dissemination of meaning in our everyday lives • The overall social impact of image-based texts differs significantly from their written counterparts, offering individuals with a more accessible method of data consumption • When starting a restaurant, need to be aware of: • Potential Clientele • Competition
“The (way the) world is framed is just as important as what is contained within that frame…” - Anne Friedberg (2007)
PopulationDensity in the Wider Sydney Area Restaurant Density in the Wider Sydney Area
Average Weekly Household Incomein the Wider Sydney Area Average Agein the Wider Sydney Area
PopulationDensity in the Wider Sydney Area Average Weekly Household Incomein the Wider Sydney Area Average Restaurant Pricingin the Wider Sydney Area
Future Restaurant Owners Anthropologists Sydney Residents EMPLOYEES Current Restaurant Owners
For More Information, See: • http://published2090.wordpress.com/ • http://emmaos23.tumblr.com/ Emma O’Sullivan, Anna Zhigalova, Paris Bosch