Download
1 / 69
690 likes | 823 Views
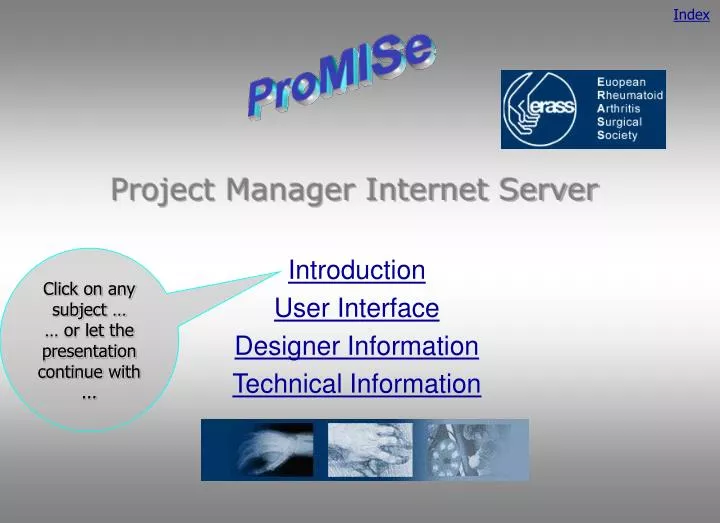
Project Manager Internet Server. Click on any subject … … or let the presentation continue with. Introduction User Interface Designer Information Technical Information. Introduction. Purpose.

E N D
Project Manager Internet Server Click on any subject … … or let the presentation continue with ... Introduction User Interface Designer Information Technical Information
Purpose ProMISe is a generic tool to Design and Manage single/multi center clinical research projects (both registrations and prospective trials) Information is stored and retrieved using the Internet Explorer browser over a (secure) internet connection The Designer (study coordinator) manages the entire project (design as well as logistics) All projects can be dynamically changed and extended during their life cycle, incorporating new scientific developments are the need for more in-depth information
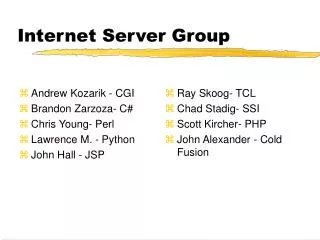
The number of studies (projects) is unlimited Studies are implemented at the Dpt of Medical Statistics of the Leiden University Medical Center (current version; the next version allows for design via Internet) Data are stored in a relational data base system in SQL-Server Tools are included to maintain the structure of the project, the data bases, log files and user access authorization tables Design
Each center has access to its own data (in full detail) and to the combined data of all centers (descriptive statistics only) The entire project is placed on a WEB server and access is managed by the WEB part of ProMISe The internet connections are protected by the Server’s security mechanisms Privacy
The user enters and retrieves data using the Internet Explorer (5.5/6) WEB browser only ProMISe contains a set of dynamic HTML forms, computed in real time and automatically reflecting the underlying structure of the project and any user preferences Only one software copy exists on a server and any updates take effect immediately in all projects and all centers User interface
The same copy of the software is used for any number of data entry/retrieval projects No programming is involved in the design and maintenance of a project: data bases with structural information are continuously queried to generate the user interface dynamically Software improvements/additions created for one project become available to all users of all projects instantaneously! Efficiency
Development of an entire Internet data management system is reduced to hours or days of (clinical) specifications instead of months or even years of programming labor All aspects of the electronic CRF’s can be modified during the study without jeopardizing the integrity of the data Additional (sub)studies or clinical trials can be integrated with very little effort Cost-effectiveness
ProMISe can also be used as an information retrieval-only system for centers while data are being entered in the central study center The ProMISe system can co-exist with any other data management system The system uses an open architecture; runs on Windows NT/2000 Server + SQL-server + IIS Web Server Organisations can independently build their own websites which can display data interactively requested from a protected ProMISe project (for example statistical data for patient information sites) Integration
Any clinical study that can be conducted using standard paper Case Report Forms (CRF’s), can also be realized within the ProMISe framework Since only standard SQL-Server tables are used, already existing data can be converted to ProMISe easily after creating the appropriate structure Users can download their own private MS-Access data bases or Excel files for local data analysis or connection to other local data base systems Application
ProMISe is in production now for over 2 years in over 500 hospitals in Europe Some of the Current Projects: Blood and Marrow Transplantation data in Europe 195 hospitals entered >10.000 transplant over the past 2 years totalling now 150.000 transplants and 300.000 follow-up records Dutch Knee Society 11 departments of Orthopaedics running a permanent registry on knee-related data Study registration in chronic leukemia in Europe All currently going-on analyses in the CLWP available to all member-researchers Clinical trials in Bone Marrow Transplantation Several multi-country trials in CLL and CML European registry on Neutropenia (under development) Clinical trial in the Netherlands on leukocyte depletion Clinical trial on transfusion triggers in orthopaedic surgery DEMO PROJECTS ON HIP, KNEE AND SHOULDER ARTHROPLASTY FOR THE NERASS GROUP Applications
DEMO PROJECTS ON HIP, KNEE AND SHOULDER ARTHROPLASTY FOR THE NERASS GROUP The projects represent the core of a much larger clinical dictionary for the registration of hip, shoulder, knee, wrist and ankle prosthesis research data The purpose is to start with a pan-European, small yet fully extendable research data set where contributing members also have full statistical access to the complete data base A scientific committee should advise about the items actually collected by all participants Statistical multi or single center analyses will be part of such a European registration project Applications
Project Manager Internet Server Click on any subject … … or let the presentation continue with ... Introduction User Interface Designer Information Technical Information
User Interface Examples drawn from 3 specific registry projects in orthopaedic surgery
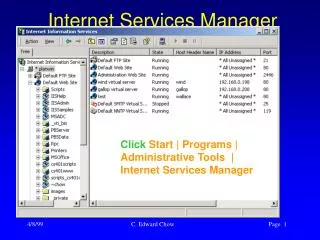
the Home page of the study center should contain a link to the list of available projects Starting point A link to all projects supported by your organization
When multiple projects are run by the same organization, a WEB page will have to list them for easy access by the users This is the last page created manually: all other WEB pages are generated in real time by the ProMISe software List of projects Click on the link of the project you want to start
Start of a session A typical page contains a button to access the PRIVATE data base for each center a button to access the COMMON data base (for information on all centers together) a button to TEST the hard and software for compatibility with ProMISe Click here to obtain anonymous info on all study data Choose your own private data base from the pick list .... TEST your configuration before using ProMISe for the 1st time! ... and press the button to start your session.
National Views can be enabled by the study coordinator Authorized users will be able to retrieve data on ALL centers within one country ProMISe automatically creates in this way a National Registry for each participating country! National Views (Registries) Click here if you are authorized to obtain information on a national level
Main View on your Session To change to another center or to the COMMON file • Tabulations: • data listings • CRF printouts • frequency tables • missing data • survival analysis Determine which items you actually want to see All other programs Enter or modify the data stored in your Private data base Close session
A quick graphical overview ... which you can change into any other item from your data base with the pick list ... Initially you see the frequency distribution of an item .....
Another item ... ... to see its frequency distribution.
Obtaining information: Tabulate Tabulation condensed overviews columnar listings of data status-like overviews frequency tables and crosstabs missing data reports survival analyses At any time during a session you can press one of the TABULATE buttons to obtain these kind of reports.
To obtain any report, you must .... choose the items to appear in the report the type of layout you want press the RECALCULATE button ... or ... choose from a list of reports prepared for you by the Designer of your project Specification of data lists To the left you see a column with all currently available items... ... in which you can simply select one or more items to appear in a report. ... and press the Calculate! button Choose the TYPE of data list you want to see ...
A condensed list is actually an overview of all Unique Identification Codes (called UIC’s) in your data base These UIC’s provide you with a link to the actual data Condensed lists 60 patients currently in the data base
each line in such a report represents one item from the data base all information on a single UIC is listed on the screen when follow-up forms are present, all of them are retrieved at once A status-like printout You can change the layout in various ways
Changing layout of a status print Just experiment by choosing from the options at the top of the screen! Here values and labels are merged into 1 column to save space
each column now represents one item each line corresponds to an individual observation a line may correspond to a UIC a line may also correspond to one particular follow-up record Requesting a columnar data list ... and press the Calculate! button ... choose the columnar structure ... Mark all items you want to appear in the report as a column ...
Columnar data list Click here ... Want to know the distribution of Gender?
Obtaining other kinds of tabulations Choose any of the 5 tabulation types and the screen will adapt itself to allow you to specify the contents of the report
ProMISe supports both one-way and two-way tables One-way tables can be displayed graphically Specification of frequency tables Choose the type of table Choose the items for which you want to count the codes ... and press the Calculate! button Tables and graphics?
Specification of a cross tabulation For a cross tabulation of 2 items, first change the structure ... ... and choose 1 item from the pick list; then press the Calculate! button again
More options are available, e.g. applying logical restrictions sorting of output Advanced specification of queries To select UIC’s choose a free SLOT.... ... and specify a restriction for example: ‘equals 1’ ... click on the item to be considered...
Use of summary statistics (means etc.) in the tables Automatically treat ‘dates’ as ‘time-elapsed-since...’ Influence presentation of multiple response items Make the tables link-sensitive Detailed specification of frequency tables Replace counts by a summary of a 3rd item Click on any category in a frequency table (or cross tabulation) to instantly obtain a list of all patients belonging to that category (or combination of categories) Replace Dates by ‘Time-elapsed since another date’
Currently 3 types are implemented: missing data reports: a listing of all UIC’s on which at least one of the items chosen by you, are missing survival analysis reports (K-M and COX) Log file reports Obtaining special reports ... and press the Calculate! button • Choose the correct layout • Webpage • Filled paper coding form • Excel spreadsheet • MS-Access data base
Overview of missing items A UIC is listed only when at least one of the items checked is missing Each item still missing is clearly marked
Selecting Items Your session was started with a ‘default’ selection of items, in this project called ‘OPERATION’. Other selections may be pre-programmed by your study coordinator or you can define them yourself
Pre-programmed ItemSelections You can switch to any other collection (just think of another paper coding form with partially overlapping information) at any time in any report or during data entry The Designer determines with which selection you always start
Data Entry! All UIC’s in your data base are loaded into a list from which you can choose Some buttons change their meaning All Follow-Up forms belonging to the current UIC are also loaded To start Data Entry on your CRF, press this button
Data Entry: the CRF The current values (obtained form the data base on the server) are automatically filled on the CRF The CRF is divided into blocks of related information by the Designer
How to load another patient (UIC) ... And press the LOAD BUTTON Just pick a UIC from the list ...
Details of the CRF Click for a new UIC (patient or transplant) Coding system and Help Label of current value Current value Description of item
Entering data on the CRF IMPORTANT you should complete each new value by pressing the ‘Tab’ key only in that way will the cursor ‘jump’ to the next item automatically Extensive help available whenever useful Click on any item you want to edit
Storing modifications IMPORTANT this counter display the number of modifications not yet saved in your data base in other words: the number of values that differ between your screen (local) and the data base (server) Press this button whenever you want to SAVE your modifications to disk in your Private data base A list of modifications to be executed appears. Press ‘Confirm’ to execute...
Quick Frequency table Click here to obtain an up-to-date overview of this item from your data base
ProMISe maintains the address tables of all participating centers The tables are kept up-to-date by your project Designer Other functions: Center ID’s Choose SHOW ADDRESSES
You can choose between Registries and Centers (if applicable) You can choose between condensed and complete addresses You can count how many UIC’s each center contributes to the COMMON file The CIC address tables Just move the mouse over the link to see the details projected at the top of the page
Downloading has a 2-fold purpose! It provides you with a BACKUP of your private data base It enables you to analyze your data locally and possibly merge your data with a MS-Access database in your own center! Other functions: downloading Choose Download from the Main Menu Then fill in this form and press the DOIT NOW button