Download
1 / 1
10 likes | 160 Views
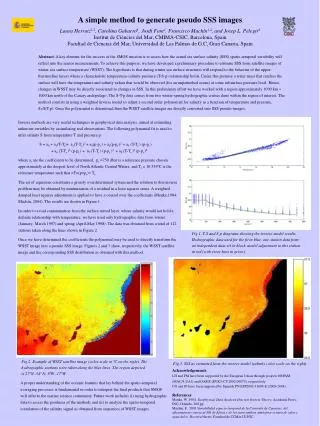
Fig.3. SSS as estimated from the inverse model (salinity color scale on the right). A simple method to generate pseudo SSS images Laura Herraiz 1,2 , Carolina Gabarró 1 , Jordi Font 1 , Francisco Machín 1,2 , and Josep L. Pelegrí 1 Institut de Ciències del Mar, CMIMA-CSIC, Barcelona, Spain

E N D
Fig.3. SSS as estimated from the inverse model (salinity color scale on the right). A simple method to generate pseudo SSS images Laura Herraiz1,2, Carolina Gabarró1, Jordi Font1, Francisco Machín1,2, and Josep L. Pelegrí1 Institut de Ciències del Mar, CMIMA-CSIC, Barcelona, Spain Facultad de Ciencias del Mar, Universidad de Las Palmas de G.C, Gran Canaria, Spain Abstract: A key element for the success of the SMOS mission is to assess how the actual sea surface salinity (SSS) spatio-temporal variability will reflect into the sensor measurements. To achieve this purpose, we have developed a preliminary procedure to estimate SSS from satellite images of winter sea surface temperature (WSST). The hypothesis is that during winter sea surface structures will respond to the behaviur of the upper-thermocline layers where a characteristic temperature-salinity-pressure (T-S-p) relationship holds. Under this premise a water mass that reaches the surface will have the temperature and salinity values that would be observed (for an unperturbed ocean) at some subsurface pressure level. Hence, changes in WSST may be directly associated to changes in SSS. In this preliminary effort we have worked with a region approximately 1000 km 1000 km north of the Canary archipelago. The S-T-p data comes from two winter-spring hydrographic cruises done within the region of interest. The method consists in using a weighted inverse model to adjust a second order polynomial for salinity as a function of temperature and pressure, S=S(T,p). Once the polynomial is determined then the WSST satellite images are directly converted into SSS pseudo-images. Inverse methods are very useful techniques in geophysical data analysis, aimed at estimating unknown variables by assimilating real observations. The following polynomial fit is used to infer salinity S from temperature T and pressure p: S = a0 + a1(T-Tr)+ a2(T-Tr )2 + a3(p-pr ) + a4(p-pr )2 + a5 (T-Tr ) (p-pr ) + a6 (T-Tr )2 (p-pr ) + a7 (T-Tr ) (p-pr )2+ a8 (T-Tr )2 (p-pr )2 where ai are the coefficients to be determined, pr =750 dbar is a reference pressure chosen approximately at the deepest level of North Atlantic Central Waters, and Tr = 10.534ºC is the reference temperature such that <T>(p=pr)= Tr. The set of equations constitutes a grossly overdetermined system and the solution to this inverse problem may be obtained by minimization of a residual in a least squares sense. A weighted damped least squares adjustment is applied to have a control over the coefficients (Menke,1984; Machín, 2004). The results are shown in Figure 1. In order to avoid contamination from the surface mixed layer, where salinity would not hold a definite relationship with temperature, we have used only hydrographic data from winter (January- March 1997) and spring (April-May 1998). The data was obtained from a total of 112 stations taken along the lines shown in Figure 2. Once we have determined the coefficients the polynomial may be used to directly transform the WSST image into a pseudo SSS image. Figures 2 and 3 show, respectively, the WSST satellite image and the corresponding SSS distribution as obtained with this method. Fig.1. T-S and S-p diagrams showing the inverse model results. Hydrographic data used for the fit in blue, one-station data from an independent data set in black, model adjustment to this station in red (with error bars in green). Fig.2. Example of WSST satellite image (color scale in ºC on the right). The hydrographic stations were taken along the blue lines. The region depicted is 27ºN -34º N; 8ºW -17ºW. Acknowledgements LH and FM have been supported by the European Union through projects ORPAM (MAC/4.2/A1) and OASIS (EVK3-CT-2002-00073), respectively. CG and JF have been supported by Spanish PN ESP2002-11604-E (2003-2004). References Menke, W.,1984. Geophysical Data Analysis:Discrete Inverse Theory, Academic Press, INC.,Orlando, 260 pp. Machín, F., 2003.Variabilidad espacio-temporal de la Corriente de Canarias, del afloramiento costero al NO de África y de los intercambios atmósfera-océano de calor y agua dulce. Doctoral thesis. Facultad de CCMar.ULPGC. A proper understanding of the oceanic features that lay behind the spatio-temporal averaging processes is fundamental in order to interpret the final products that SMOS will offer to the marine science community. Future work includes (i) using hydrographic data to assess the goodness of the methods and (ii) to analyze the spatio-temporal correlation of the salinity signal as obtained from sequences of WSST images.


![[Generate Sales] A Super Simple Trick To Generate Sales Quickly](https://cdn5.slideserve.com/10077365/profit-boost-tip-dt.jpg)