Download
1 / 39
400 likes | 552 Views
Ecology of Populations. Chapter 46. Chapter Outline. Scope of Ecology Population Density and Distribution Population Growth Models Survivorship Curves Age Distributions Regulation of Population Size Life History Patterns Human Population Growth Environmental Impact. Scope of Ecology.

E N D
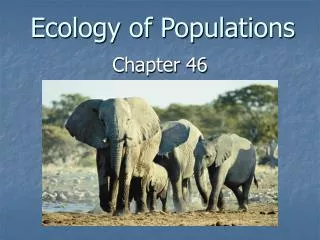
Ecology of Populations Chapter 46
Chapter Outline • Scope of Ecology • Population Density and Distribution • Population Growth Models • Survivorship Curves • Age Distributions • Regulation of Population Size • Life History Patterns • Human Population Growth • Environmental Impact
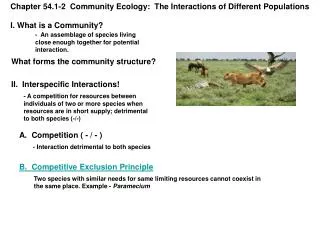
Scope of Ecology • Ecology – what is it? • Definitions: • Habitat - Place where an organism lives. • Population - All the organisms within an area belonging to the same species. • Community - All various populations interacting at same locale. • Ecosystem – A collection of communities
Density and Distribution of Populations • Population Density - Number of individuals per unit area or volume. • Population Distribution - Pattern of dispersal of individuals within the area of interest.
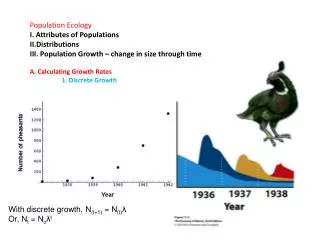
Characteristics of Populations • They tend to grow • Intrinsic Rate of Natural Increase (r)
Population Growth Models • Exponential Growth • Biotic Potential • Environmental Resistance
Logistic Growth • Logistic growth—indicated by an S-shaped curve • Difference between logistic and exponential due to environmental resistance
Carrying Capacity • Carrying Capacity is the maximum number of individuals of a given species the environment can support. • The closer the population to the carrying capacity, the greater the environmental resistance. • Biotic potential is having full effect and birthrate is a maximum during exponential growth.
Mortality Patterns • Cohort --- all the members of a population born at the same time. • Survivorship---the probability of newborn individuals of a cohort surviving to particular ages. • Illustrated by Survivorship Curves
Age Distributions • What proportion of population is in each cohort? • Age Structure Diagrams
Regulation of Population Size • Density - Dependent Factors • Density - Independent Factors
Factors That Affect Population Size Density Dependent Factors • 1. Competition • Intraspecific • Interspecific Predation Parasitism 4. Disease
Factors That Affect Population Size Density Independent Factors Abiotic factors 2. Unpredictable, catastrophic events
Life History Patterns • r - Strategists (Opportunistic) • Remember r=reproduction
Life History Patterns • k - Strategists (Equilibrium) • Remember k=Karrying kapacity
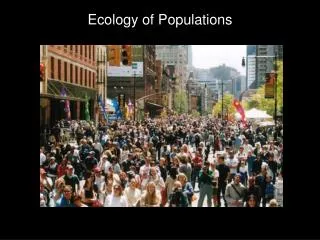
Human Population Growth • Human population has had an exponential growth pattern. • Doubling time currently estimated at 53 years. • Population Size • 1800 1 Billion • 1930 2 Billion • 1960 3 Billion • 2000 6 Billion
Country Development • More-Developed Countries (MDCs) GR=0.1% • Less-Developed Countries (LDCs) GR= 1.6% • LDC population expected to increase from 5-8b by 2050
Age Distributions • Age Structure Diagrams divide populations into three age groups. • Pre-Reproductive • Reproductive • Post-Reproductive
The Demographic Transition • Stage I: high birthrates and death rates • Stage II: continued high birthrates, declining death rates • Stage III: falling birthrates and death rates, eventually stabilizing
Age Distribution of the World’s Population Population Structures by Age and Sex, 2005 Millions Less Developed Regions More Developed Regions Age 80+ 75-79 70-74 65-69 60-64 55-59 50-54 45-49 40-44 35-39 30-34 25-29 20-24 17-19 10-16 5-9 0-4 Male Female Male Female Source: United Nations, World Population Prospects: The 2002 Revision (medium scenario), 2003.
Figure 7.2 World Population Distribution by Region, 1998 and 2050
Environmental Impact • Measured in terms of: • Population Size • Resource Consumption Per Capita • Resultant Pollution
Review • Scope of Ecology • Population Density and Distribution • Population Growth Models • Survivorship Curves • Age Distributions • Regulation of Population Size • Life History Patterns • Human Population Growth • Environmental Impact