Download
1 / 5
50 likes | 53 Views
All morphological physical features of human body change throughout oneu2019s life span and the rates of change are not constant. The maturity of the anthropometric characteristics varies among populations due to genetic make-up, environment and other concomitants. Generally, physical dimensions are at peak from age 20 to 35 years. In this stage a maximum level is attained by the physiological capacity of various systems. Physiological functions start to decline after 35 years at different rates in different people. There is continuous quantitative and qualitative reduction of skeletal muscle mass and fat redistribution in the body. As people aged abdominal fat also increased with age and it affect the women waist circumference, Waist-Hip circumference ratio these compositional changes increase the risk of cardiovascular disease, hypertension and different other health problems.

E N D
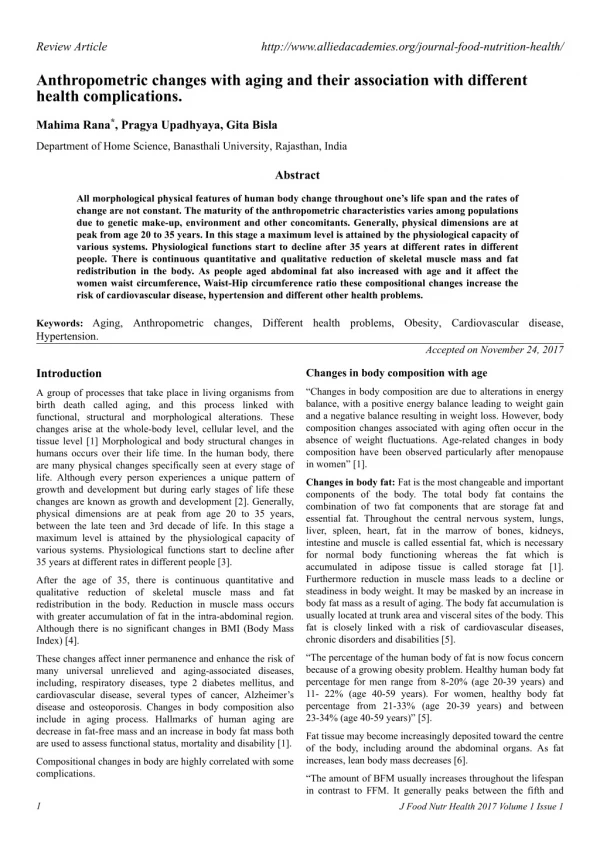
Review Article http://www.alliedacademies.org/journal-food-nutrition-health/ Anthropometric changes with aging and their association with different health complications. Mahima Rana*, Pragya Upadhyaya, Gita Bisla Department of Home Science, Banasthali University, Rajasthan, India Abstract All morphological physical features of human body change throughout one’s life span and the rates of change are not constant. The maturity of the anthropometric characteristics varies among populations due to genetic make-up, environment and other concomitants. Generally, physical dimensions are at peak from age 20 to 35 years. In this stage a maximum level is attained by the physiological capacity of various systems. Physiological functions start to decline after 35 years at different rates in different people. There is continuous quantitative and qualitative reduction of skeletal muscle mass and fat redistribution in the body. As people aged abdominal fat also increased with age and it affect the women waist circumference, Waist-Hip circumference ratio these compositional changes increase the risk of cardiovascular disease, hypertension and different other health problems. Keywords: Aging, Anthropometric changes, Different health problems, Obesity, Cardiovascular disease, Hypertension. Accepted on November 24, 2017 Introduction Changes in body composition with age “Changes in body composition are due to alterations in energy balance, with a positive energy balance leading to weight gain and a negative balance resulting in weight loss. However, body composition changes associated with aging often occur in the absence of weight fluctuations. Age-related changes in body composition have been observed particularly after menopause in women” [1]. A group of processes that take place in living organisms from birth death called aging, and this process linked with functional, structural and morphological alterations. These changes arise at the whole-body level, cellular level, and the tissue level [1] Morphological and body structural changes in humans occurs over their life time. In the human body, there are many physical changes specifically seen at every stage of life. Although every person experiences a unique pattern of growth and development but during early stages of life these changes are known as growth and development [2]. Generally, physical dimensions are at peak from age 20 to 35 years, between the late teen and 3rd decade of life. In this stage a maximum level is attained by the physiological capacity of various systems. Physiological functions start to decline after 35 years at different rates in different people [3]. Changes in body fat: Fat is the most changeable and important components of the body. The total body fat contains the combination of two fat components that are storage fat and essential fat. Throughout the central nervous system, lungs, liver, spleen, heart, fat in the marrow of bones, kidneys, intestine and muscle is called essential fat, which is necessary for normal body functioning whereas the fat which is accumulated in adipose tissue is called storage fat [1]. Furthermore reduction in muscle mass leads to a decline or steadiness in body weight. It may be masked by an increase in body fat mass as a result of aging. The body fat accumulation is usually located at trunk area and visceral sites of the body. This fat is closely linked with a risk of cardiovascular diseases, chronic disorders and disabilities [5]. After the age of 35, there is continuous quantitative and qualitative reduction of skeletal muscle mass and fat redistribution in the body. Reduction in muscle mass occurs with greater accumulation of fat in the intra-abdominal region. Although there is no significant changes in BMI (Body Mass Index) [4]. “The percentage of the human body of fat is now focus concern because of a growing obesity problem. Healthy human body fat percentage for men range from 8-20% (age 20-39 years) and 11- 22% (age 40-59 years). For women, healthy body fat percentage from 21-33% (age 20-39 years) and between 23-34% (age 40-59 years)” [5]. These changes affect inner permanence and enhance the risk of many universal unrelieved and aging-associated diseases, including, respiratory diseases, type 2 diabetes mellitus, and cardiovascular disease, several types of cancer, Alzheimer’s disease and osteoporosis. Changes in body composition also include in aging process. Hallmarks of human aging are decrease in fat-free mass and an increase in body fat mass both are used to assess functional status, mortality and disability [1]. Fat tissue may become increasingly deposited toward the centre of the body, including around the abdominal organs. As fat increases, lean body mass decreases [6]. Compositional changes in body are highly correlated with some complications. “The amount of BFM usually increases throughout the lifespan in contrast to FFM. It generally peaks between the fifth and 1 J Food Nutr Health 2017 Volume 1 Issue 1
Citation:Mahima R, Pragya U, Gita B. Anthropometric changes with aging and their association with different health complications. J Food Nutr Health 2017;1(1):1-5. seventh decades of life and then remains constant or decreases slightly [1]. Even though the amount of BFM is caused by genetic factors, it is also influenced by non-genetic factors, such as physical inactivity combined with an increased intake of energy dense foods that are high in lipids or carbohydrates. Excess BFM is linked with obesity with advancing age, and in both males and females; it is a strong but modifiable risk factor for all- cause mortality” [7]. Obesity has more than doubled since 1980 according to the latest World Health Organization report. Globally, more than 1.4 billion adults (aged 20 years and over) are overweight [8]. In healthy adult, muscles are important for body weight. After the age of 30, there is around 1% loss in muscle mass per decade. Physically inactive people can lose as much as 3% to 5% of their muscle mass per decade. This loss of muscles may affect the health as well as overall strength of the body [13]. Between the ages of 40 years to 50 years, there is the biggest change in fat and muscle mass. Between the ages of 50 years to 70 years, averagely, people reduce about 30% of their strength [14]. Between the ages of 40 years to 50 years, there is the biggest change in fat and muscle mass. A recent study stated that the total muscle mass is decreases nearly 50% between the ages of 20 years to 90 years. Between 50 years to 70 years of age, people lose about 30% of their strength averagely and after that another 30% is lost per decade [5]. Changes in body water: Water is the vital medium of the internal environment and the chief chemical constituent of the body. Approximately, there are 65% of total body water is intracellular and 35% water is extracellular. The difference of this range is because of leanness and fatness and sex and age difference, so if there are more muscles then there is proportionately more water. In comparison to women healthy adult men have bigger amounts of total body water as a result of their high muscle mass and larger size. To estimate FFM and FM, total body water can be used [9]. Changes in anthropometric measurements “Anthropometrics means the measurement of body parts, has been used as a sensitive indicator of wellness, maturation and development in humans at different age categories. It is the only inexpensive, universally applicable and non-invasive method which is available for the assessment of size, proportion and composition of human body” [15]. Around the middle age of men and women, the level of total body water reportedly begins to decline gradually and is rapidly in women. This decline may occur because of the decrease in the amount of total body cell mass, intra cellular body water or a fall in the volume of extracellular water [9]. Changes in BMI: “Traditionally, BMI have been the preferred indicator by which to assess body size and composition, and to diagnose underweight and overweight. However, waist circumference, waist–hip ratio and waist-height ratio are alternative measures that reflect abdominal adiposity and have been recommended as being superior to BMI in predicting CVD risk. Basically, this is based on the justification that increased visceral adipose tissue which is linked with a range of metabolic abnormalities, including decreased glucose tolerance and insulin sensitivity, and adverse lipid profiles, which are risk factors for type 2 diabetes and CVD. As women body weight increase changes in BMI also occur and these changes affect the human health. These changes are direct correlated with different health problems. Higher BMI has found to be associated with increased reporting of headaches, back pain, hypertension, asthma, irregular monthly periods, and difficulty in sleeping” [16]. “Usually, healthy adult men consistently have larger amounts of total body water than women due to a function of their larger size and muscle mass [10]. Reportedly the level of total body water starts to decline around middle age in men and women and is speedy in women after around 60 years of age the average decline between 20 and 60 years of age is reported to be about 4 litres in men and 6 litres in women [11]. This reduction is due to either a decline in total body water volume with aging or as a gain in weight and fatness that also occurs with increased age in many adults today [12]. In describing total body water content among individuals at any point in life, body fatness is considered as the most important factor. However, among individuals, the extent to which variations in levels of fatness affects total body water has not been presented. On the change in total body water with age, the effect of the level of fatness is an essential factor in interpreting the clinical management of total body water [11]. Changes in waist circumference “An anthropometric measure of abdominal fatness, waist circumference appears to be more strongly linked with the risk of diabetes than anthropometric measures of common fatness. If a person is overweight, waist circumference can also give some information about your risk of developing health problems (particularly coronary heart disease and type 2 diabetes)” [17]. As people aged abdominal fat also increased and it affects the waist circumference. Waist circumference values of 85 cm and 102 cm, if these waist circumference values increased from the cutoff point then it increased risk of CVD in women and men respectively. Increased waist circumference is associated with a more atherogenic risk profile. Because it increases the cardio metabolic risk factors (lipid profile, systolic hypertension, and abnormal fasting blood glucose [18]. Changes in fat free mass or muscle mass: FFM of body is made up of muscle mass and other structural component of body. As human grows, FFM usually increases, remains relatively constant throughout maturity and declines during senescence. Commonly, FFM peaks between the fourth and fifth decades of life, occasionally earlier and then declines slightly [7]. The reduction in FFM primarily occurs as a component of FFM, outcome of losses in muscle mass and is considered the most constant indicator of aging. Besides this, by the loss of muscle mass; the decline in muscle strength contributes to the decline in physical function as well as increasing disability, weakness and loss of liberty [8]. 2 J Food Nutr Health 2017 Volume 1 Issue 1
Mahima et al. “When central adiposity is measured indirectly with an anthropometric measure such as waist circumference, CVD risk factors are also seen. In epidemiologic studies, such measures are usually used that examine the role of central adiposity in disease risk of women. Waist circumference is a significant predictor of blood pressure and TC (total cholesterol), LDL- cholesterol, triglyceride concentrations, because waist circumference is correlated with total body fat” [19]. organs. The prevalence of obesity among younger women has been found to be lower in comparison of middle aged or older women [26]. In the years surrounding menopause, women are particularly vulnerable to weight gain [27]. In many ways, obesity negatively effects on the health of women which enhances the relative risk of coronary artery diseases, diabetes, and higher risk of multiple cancers, including breast cancer and endometrial cancer [26]. HDL-cholesterol, and With increased age, incidence of obesity makes a complicating relationship between muscle mass, weight changes and decreasing strength [27]. Changes in waist hip circumference ratio Waist–hip ratio cut off values for men and women are 0.90 and 0.80, respectively. High waist hip ratio values are linked with mortality and many medical conditions such as type 2 diabetes, CVD, anovulation cycles, gallbladder disease, carcinomas, lung function impairment, menstrual irregularity, and low fecundity [20]. Hypertension: “The prevalence of hypertension has increased over the last decade. Essential hypertension accounts for more than 90% of cases of hypertension. In a recent review; the lifetime risk of becoming hypertensive in industrialized countries was estimated to exceed 90%. In blood pressure levels, the gender difference appears during adolescence but a transfer in relative prevalence of hypertension occurs in the elderly [28]. From all causes in both men and women, waist hip ratio was found to be positively associated with the incidence of myocardial infarction, stroke, and death. It has been associated with increased blood pressure and decreased high density lipoprotein [21]. High waist hip ratio was associated with hypertension and diabetes [22]. Body fat distribution has also been associated with fasting and stimulated levels of glucose and insulin and to increased rates of diabetes. There have been few studies that have systematically investigated the behavioural or psycho-social factors associated with waist hip ratio [21]. In comparison with age-matched men, premenopausal women have lower risk and incidence of hypertension but this advantage for women gradually disappears after menopause. A higher percentage of women in comparison with men, have hypertension after 65 years of age, and the gap will probably increase with the continued aging of the female population [29]. Between the ages of 65 and 74 years, the prevalence of hypertension is as high as 58% in women. Hypertension is a chief risk factor for the early development of heart disease, stroke, and heart and kidney failure. In comparison with normotensive individuals, the risk of a heart attack or kidney failure increases four- fold in individuals with (systemic arterial hypertension) SAH>160 mmHg; and the risk of heart failure doubles after 40 years of a age [30]. Compositional changes in body are highly correlated with some complications: Health complications with age Obesity: High body fat is called obesity which is a pathological condition with excess body fat. It is a chronic disorder having complex interaction between environmental and genetic factors. It is being characterized by high cholesterol, excessive adipose mass accumulation, fatty acid levels, high blood pressure and insulin desensitization [23]. Obesity is one of the most widespread problems all over the world. About 25% of children and 40-60% of adults in all developed countries suffer from the excess weight which causes physiological and psychological changes of the body, as well as serious health problems [24]. Basically, this high prevalence of hypertension is a development that is part of the ageing process in individuals of both sexes [31]. Obesity is also a significant risk factor in the pathogenesis of arterial hypertension. There is the additional effect of the estrogen depletion that occurs at menopause among women [30].” Cardiovascular communicable diseases having a major share of incidences which have been leading cause of morbidity and mortality. In India, females of urban population are more prone to cardiovascular diseases (CVD’s). Recent trends declare that the prevalence of these diseases has also occurred into younger age groups [31]. diseases (CVD): CVD are non- The prevalence of obesity is higher (39.4%) among middle age adults between 40 years to 59 years, than lower (32.0%). Fat can subcutaneous or visceral according to its location. The saturated fat is linked with the primitive fat around the middle body section, which may hamper with the proper functioning of vital organs. There is an association between specific fat deposits and overall fat deposits. For degenerative diseases, abdominal fat is most correlated factor [25]. A good nutritional status of adults has important for her health and health of her children too. In comparison men and women, the essential fat level is higher in women as it includes sex-characteristic and issues linked to fat during child bearing. It is clear that increased body fat affects our health and health of specific Generally women are less likely to get heart disease until menopause. It is believed that estrogen hormone provides protection to the heart until natural menopause but after menopause risk increases. By the age of 60 to 65 years, women and men have the same risk of heart disease [32]. Osteoporosis: It is a disease in which bones are more fragile and have less density, thus, there is a high risk of fracture. It is 3 J Food Nutr Health 2017 Volume 1 Issue 1
Citation:Mahima R, Pragya U, Gita B. Anthropometric changes with aging and their association with different health complications. J Food Nutr Health 2017;1(1):1-5. most common in women after menopause between the ages of 45 to 55 years. Bone mass of women begins to lose more rapidly in comparison of men. After menopause, women produce much less of the estrogen hormone and this hormone make the bone strong [33]. 14.Keller K, Engelhardt M. Strength and muscle mass loss with aging process, Age and strength loss. Muscle, Ligaments and Tendons Journal. 2013;3:346-50. 15.Chinedu SN, Ogunlana OO, Azuh DE, et al. Correlation between body mass index and waist circumference in nigerian adults: implication as indicators of health status. Journal of Public Health Research. 2013;2:2-16. 16.Varte LR, Rawat S. Relationship of Body mass index, waist circumference and waist- stature ratio with body fat of the indian Gorkha population. Malaysian Journal of Nutrition. 2013;19:185-92. 17.Barreira TV, Staiano AE, Harrington DM, et al. Anthropometric correlates of total body fat, abdominal adiposity, and cardiovascular disease risk factors in a biracial sample of men and women. Journal of Mayo Clinic and Procedings. 2012;87:452-60. 18.Berentzen TM, Jakobsen MU, Halkjaer J, et al. Changes in waist circumference and the incidence of diabetes in middle-aged men and women. Plos One. 2011;6. 19.Tybor DJ, Lichtenstein AH, Dallal GE, et al. Independent effects of age- related changes in waist circumference and BMI z scores in predicting cardiovascular disease risk factors in a prospective cohort of adolescent females. American Journal of Clinical Nutrition. 2011;93(2): 392-401. 20.Krzysztof K. Assessment attractiveness in women: An anthropometric Analysis of digital silhouettes. Archives of Sexual Behaviour. 2014;43:989-97. 21.Wing RR, Matthews KA, Kuller LH, et al. Waist to Hip Ratio in Middle-Aged Women Associations With Behavioral and Psychosocial Factors and With Changes in Cardiovascular Risk Factors. Journal of American Heart Association. 1991;115:1250-7. 22.Hall ME, Carmo JMD, Silva AAD, et al. Obesity, hypertension, and chronic kidney disease. International Journal of Nephrology and Reno vascular Disease. 2014;7:75-88. 23.Gupta N, Goel K, Shanp M. Childhood Obesity in Developing Countries: Epidemiology, Determinants, and Prevention. Endocrine Reviews. 2012;33(1):48-70. 24.Lobestin T, Baur L. Obesity in children and young people: a crisis in public health. IASO International Obesity Task Force. 2004;5(1):4-85. 25.Das S, Chowdhary T, Bose K. Age variations in anthropometric and body composition characteristics among adult bauri females of paschim Medinipur, West Bengal, India. Scholarly Journal of Scientific Research and Essay Writing. 2012;1(2):10-8. 26.Kulie T, Slattengren A, Redmer J, et al. Obesity and women’s health: an evidence-based review. The Journal of the American Board and Medicine. 2011;24:75-85. 27.Thompson DL, Rakow J, Perdue SM. Relationship between accumulated walking and body composition in middle aged women. Medicine and Science in Sports and Exercise. 2004;36(5):911-3. Human body changes during adulthood may be affected by various modify able factors they can determine the health status. Abbreviations FFM: Fat-Free Mass; BFM: Body Fat Mass; FM: Fat Mass; BMI: Body Mass Index. References 1. Gaba A, Pridalova M. Age-related changes in body composition in a sample of Czech women aged 18–89 years: a cross-sectional study. European Journal of Nutrition. 2014;53:16-76. 2. Das BM, Roy SK. Age changes in the anthropometric and body composition characteristics of the bishnupriya manipuris of Cachar district, Assam. Advances in Bioscience and Biotechnology. 2010;1:122-30. 3. Jagga A, Lehri M, Verma SK. Effect of aging and anthropometric measurements on nerve conduction properties-A Review. Journal of Exercise Science and Physiotherapy. 2011;7:1-10. 4. Almedia MF, Marucci MFN, Gobbo LA, et al. Anthropometric changes in the Brazilian cohort of older adults: Abe survey (Health, Well Being, and Aging). Journal of Obesity. 2013;2013:1-9. 5. Milanovic Z, Pantelic S, Trajkovic N, et al. Basic anthropometric in an elderly population: A systematic review. Facta Universities. 2011;9:173-82. 6. NY Time (2017). 7. Chumlea WC, Guo SS, Zeller CM, et al. Total body water data for white adults 18 to 64 years of age. Kidney International. 1999;56:244-52. 8. Zamboni M, Mazzali G, Fantin F, et al. Sarcopenic obesity: a new category of obesity in the elderly. Journal of Nutrition, Metabolism and Cardiovascular Diseases. 2008;18:388-95. 9. Chang SH, Beason TS, Hunleth JM, et al. A systematic review of body fat distribution and mortality in older people. Journal of Maturitas. 2012;72:175-91. 10.www.who.int/mediacentre/factsheets/fs311/en/. 11. Lesser GT, Markofsky J. Body water compartments with human aging using fat- free mass as the reference standard. American Journal of Physiology. 1979;236:215-20. 12.Steen B. Body water in the elderly: A review. Journal of Nutrition Health and Aging. 1997;1:142-5. 13.English KL, Jones DP. Protecting muscle mass and function in older adults during bed rest. Current Opinion in Clinical Nutrition Metabolic Care. 2010;13:34-9. of waist-to-hip ratio 4 J Food Nutr Health 2017 Volume 1 Issue 1
Mahima et al. 28.Chan RSM, Woo J. Prevention of overweight and obesity: how effective is the current public health approach. International Journal of Environmental Research and Public Health. 2010;7(3):765-83. 29.Gudmundsdottir H, Hoieggen A, Stenehjem A, et al. Hypertension in women: latest findings and clinical implications. Journal of Therapeutic Advance Chronic Disease. 2012;3(3):137-46. 30.Yang XP, Reckelhof JF, Estrogen, hormonal replacement therapy and cardiovascular disease. Journal of Current Opinion in Nephrology and Hypertension. 2011;20(2): 133-38. 31.Taddei S. Blood pressure through aging and menopause. Climacteric Journals. 2009;12(1):36-40. 32.Chauhan S, Aeri BT. Prevalence of cardiovascular disease in India and its economic impact- A review. International Journal 2013;3(10):2250- 3153. 33.https://www.med.umich.edu/1info/FHP/practiceguides/ osteoporosis/OsteoporosisInWomen.pdf of Scientific and Research Publications. *Correspondence to Mahima Rana Department of Home Science Banasthali University Rajasthan India E-mail: rana123mahima@gmail.com 5 J Food Nutr Health 2017 Volume 1 Issue 1