Download
1 / 37
380 likes | 601 Views
Kinematics. The branch of mechanics that studies the motion of a body without caring about what caused the motion. Position. Location of a particle in space. One dimension (x) Two dimensions (x,y) Three dimensions (x,y,z). 1-Dimensional Coordinates. x = 1 m. -1. 0. 1. 2. 3. X (m).

E N D
Kinematics The branch of mechanics that studies the motion of a body without caring about what caused the motion.
Position • Location of a particle in space. • One dimension (x) • Two dimensions (x,y) • Three dimensions (x,y,z)
1-Dimensional Coordinates x = 1 m -1 0 1 2 3 X (m)
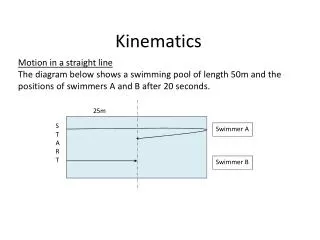
Distance • The total length of the path traveled by an object. • Does not depend upon direction. • “How far have you walked?”
xf = -1 m 1-Dimensional Coordinates Distance moved by particle is 2 meters. xi = 1 m -1 0 1 2 3 X (m)
Displacement • The change in position of an object. • Depends only on the initial and final positions, not on path. • Includes direction. • “How far are you from home?”
Displacement • Represented by x. • x = x2 - x1 where x2 = final position x1= initial position
xf = -1 m 1-Dimensional Coordinates Distance moved by particle is 2 meters. Displacement of particle is -2 meters. xi = 1 m -1 0 1 2 3 X (m)
Distance vs Displacement B 100 m displacement 50 m distance A
Students have difficulties interpreting information presented graphically. • Common Misconceptions: • Graph of a-versus-b: • graphing the first quantity on the horizontal axis, thereby reversing the two axes • Slope of a straight-line graph: • y/xrather than Δy/Δx • Ignore scales and units along the axes
Common Misconceptions contd.: • Slope of a curved line cannot be calculated • Slope at any given point cannot be calculated • Area under a curve: • “Distance traveled is the area under thev(t) curve.” But distance is a length? How can a length equal an area?
Calculating Slope: Students calculate the slope of the graph and understand that the value obtained is an average. When the velocity is constant, the average velocity over any time interval is equal to the instantaneous velocity at any time.
KINESTHETIC EXPERIENCE. . .then translate • from an actual motion to its representation on a graph • from the graph to an actual motion
Give a qualitative description of the motion depicted in the graphs: a. v Object moving to the right at a fast constant speed. t b. v Object moving to the left at a slower constant speed. t
a. x Object starts at the origin and moves in the positive direction with constant velocity. t Object starts to the right of the origin and moves in the negative direction with constant velocity ending at the origin. x b. t
c. x Object starts to the right of the origin and moves in the positive direction with constant velocity. t x d. Object starts to the left of the origin and moves in the positive direction with constant velocity ending at the origin. t
e. x Object starts to the left of the origin and moves in the negative direction with constant velocity. t x f. Object starts to the right of the origin and moves in the negative direction with constant velocity. t
STACKS OF GRAPHS Changing from one type of graph to another. • Give a verbal description of the motion given • Draw the other type(s) of graph(s)
Translating motion between various graphs: Pvs.T, Vvs.T, & Avs.T vo = 0 x = 0 v x a t t t
vo = 0 x = 0 v x a t t t
vo = 0 x = 0 v x a t t t
vo ≠ 0 x = 0 v x a t t t
vo = 0 x = 0 v x a t t t
vo= 0 x = 0 v x a t t t
This qualitative approach helps the student understand that: • the sign of the velocity and the acceleration is the same if • the object is speeding up and that • the sign of the velocity and the acceleration is the opposite • if the object is slowing down.
INTERPRETING GRAPHS Which point or points on the v(t) graph show instants at which there was: v (m/s) t (s)
v (m/s) t (s) a. Uniform motion in the (+) direction? b. Uniform motion in the (-) direction? c. At rest? d. (+) acceleration with (+) velocity? e. (-) velocity with (+) acceleration? f. (-) acceleration with (+) velocity? g. (-) velocity with (-) acceleration? h. 0 velocity and (-) acceleration? 1 5 3, 7 none 6 2 4 3
OR. . . . v (m/s) t (s) • Label the following regions of the graph. • Where the object is traveling in the (+) direction: • When the object is at rest: • c. When the object is undergoing positive acceleration: AC FG EF
INTERPRETING GRAPHS: x(t) Which points on the x(t) graph show instants at which there is: x (m) t (s) • Uniform motion in the (+) direction? • (+) acceleration with (+) velocity? • (+) acceleration and zero velocity? 3 2 none
2000B1: A 0.50 kg cart moves on a straight horizontal track. The graph of velocity v vs. time t for the cart is given below.
2000B1 • Indicate every time tfor which the cart is at rest. (t = 4 s, 18 s) • Indicate every time interval for which the speed (magnitude of velocity) of the cart is increasing. (Δt = 4-9 s and 18-20 s) • c) Determine the horizontal position x of the cart at t = 9.0 s if the cart is located at x = 2.0 m at t= 0. (1.1 m)
d) On the next graph, sketch the acceleration a versus time t graph for the motion of the cart from t = 0 to t= 25 s.
Pick the constant velocity graph(s)… x v A C t t v x B D t t
x v a t t t Acceleration vs time Position vs time Velocity vs time Summary:Constant position graphs
x v a t t t Acceleration vs time Position vs time Velocity vs time Summary:Constant velocity graphs
x v a t t t Acceleration vs time Position vs time Velocity vs time Summary:Constant acceleration graphs