Download
1 / 19
190 likes | 305 Views
This chapter introduces the fundamental concepts of functions, including their definitions, notation, and how to model real-world phenomena using functions. It discusses domain and range, the distinction between discrete and continuous functions, and the significance of having one output for each input. Additionally, we explore the average rate of change and the behavior of functions through examples, such as women's shoe size based on foot measurements and the area of a square with changing side lengths. Through exercises, the chapter facilitates hands-on learning and practical application of these concepts.

E N D
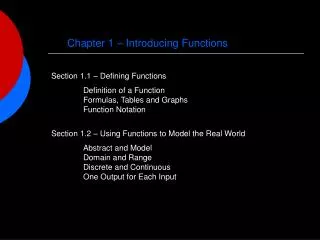
Chapter 1 – Introducing Functions Section 1.1 – Defining Functions Definition of a Function Formulas, Tables and Graphs Function Notation Section 1.2 – Using Functions to Model the Real World Abstract and Model Domain and Range Discrete and Continuous One Output for Each Input
Exercises from Sections 1.1 and 1.2 1/10 – domain of men’s shoe function 5/10 – domain 6/10 - domain 2/13 – function notation 3/13 – function notation 4/13 – function notation 5/13 – function notation 6/13 – function notation 11/32 – function notation 12/32 – function notation 23/33 – weird function
Section 1.3Watching Functions Values Change pages 17 - 29
Section 1.3 – Watching Function Values Change Example 1: women’s shoe size functionw(x) = 3x – 21 y = 3x - 21 y (shoe size) depends on x (foot measurement)HOW? What is the change in shoe size when: foot length increases from 9 inches to 9 1/6 inches (by 1/6) foot length increases from 9 1/6 to 9 1/3 inches (by 1/6) foot length increase from 10 inches to 10 ½ inches (by 1/2) foot length increases by a full inch during the course of a career.
Example 1 foot length increases from 9 inches to 9 1/6 inches (by 1/6) shoe size increases by 0.5 foot length increases from 9 1/6 to 9 1/3 inches (by 1/6) shoe size increases by 0.5 foot length increase from 10 inches to 10 ½ inches (by 1/2) shoe size increases by 1.5 foot length increases by a full inch during the course of her career. shoe size increases by 3
Example 1 women’s shoe size functionw(x) = 3x – 21 y = 3x - 21 y (shoe size) depends on x (foot measurement)HOW? Do you see a pattern? change in y is always 3 times the change in x or change of one unit in x always produces a change of 3 units in y or rate of change is 3 [shoe sizes per 1 inch]
Section 1.3 – Watching Function Values Change Definition (pg 17)The rate of change of y with respect to x is given by: Definition (pg 18)The average rate of change of any function y = f(x) from x = a to x = b is the ratio:
Example 1 women’s shoe size functionw(x) = 3x – 21 y = 3x - 21 y (shoe size) depends on x (foot measurement)HOW? Use the definition to determine the average rate of change of the women’s shoe size function for: x from 9 to 9 1/6 x from 9 1/6 to 9 1/3 x from 10 to 10 1/2 x from 9 to 10 x from a to b
Example 1 Can we see the rate of change on the graph of the women’s shoe size function? Constant Rate of Change = Straight Line Graph
Section 1.3 – Watching Function Values Change Example 2the area of a square depends on the length of its side A(s) = s2 HOW? Use the definition to determine the average rate of change of the area function for: s from 1 to 2 s from 2 to 3 s from 3 to 4
Example 2 Use the figures to determine the average rate of change of the area function for: s from 1 to 2 s from 2 to 3 s from 3 to 4
Example 2 Can we see the rates of change on the graph of the area function? Rate of Change is Changing
Section 1.3 – Watching Function Values Change The Shape of a Graph We say a function is increasing if the value of the dependent variable increases as the value of the independent variable increases i.e. as we read the graph from left to right, the y values of points on the graph get larger. i.e. the graph rises as we read left to right
Section 1.3 – Watching Function Values Change The Shape of a Graph We say a function is decreasing if the value of the dependent variable decreases as the value of the independent variable increases i.e. as we read the graph from left to right, the y values of points on the graph get smaller. i.e. the graph falls as we read left to right
Section 1.3 – Watching Function Values Change The Shape of a Graph What about average rates of change for increasing functions?
Section 1.3 – Watching Function Values Change The Shape of a Graph What about average rates of change for decreasing functions?
Section 1.3 – Watching Function Values Change The Shape of a Graph We say the graph of a function is concave up if the rates of change increase as we move left to right. We say the graph of a function is concave down if the rates of change decrease as we move left to right.
Where is f increasing? Where is f decreasing? Where is graph concave up? Where is graph concave down?
Section 1.3 – Watching Function Values Change Homework: Page 33: #25-31Page 40: #1, 2 Turn in: 26,27,30, 31 Read and begin work on Lab 1B (pp 46-50)