Download
1 / 48
480 likes | 676 Views
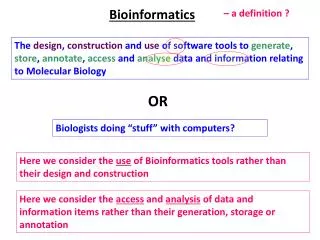
Bioinformatics. Prof. Navneet Goyal Department of Computer Science & Information Systems BITS, Pilani. Sequence Analysis. Topics for Today What is sequence analysis? Why we need it? How we do it? What are the tools available?. Sequence Analysis.

E N D
Bioinformatics Prof. Navneet Goyal Department of Computer Science & Information Systems BITS, Pilani
Sequence Analysis Topics for Today • What is sequence analysis? • Why we need it? • How we do it? • What are the tools available?
Sequence Analysis • Sequence data is the most abundant type of biological data available electronically • Importance of sequence data to Biology remains central • Major Sequence Databases?
Sequence Databases • GenBank at the National Center of Biotechnology Information, National Library of Medicine, Washington, DC accessible from:http://www.ncbi.nlm.nih.gov/Entrez • European Molecular Biology Laboratory (EMBL) Outstation at Hixton, Englandhttp://www.ebi.ac.uk/embl/index.html • DNA DataBank of Japan (DDBJ) at Mishima, Japanhttp://www.ddbj.nig.ac.jp/ • Protein International Resource (PIR) database at the National Biomedical Research Foundation in Washington, DC (see Barker et al. 1998)http://www-nbrf.georgetown.edu/pirwww/ • 5.
Sequence Databases • The SwissProt protein sequence database at ISREC, Swiss Institute for Experimental Cancer Research in Epalinges/Lausannehttp://www.expasy.ch/cgi-bin/sprot-search-de • The Sequence Retrieval System (SRS) at the European Bioinformatics Institute allows both simple and complex concurrent searches of one or more sequence databases. The SRS system may also be used on a local machine to assist in the preparation of local sequence databases.http://srs6.ebi.ac.uk
Websites for Sequence Alignment • Bytes Block Aligner http://www.wadsworth.org/res&res/bioinfo • BCM Search Launcher: Pairwise sequence alignment http://searchlauncher.bcm.tmc.edu/seq-search/alignment.html • SIM—Local similarity program for finding alternative alignments http://www.expasy.ch/tools/sim.html • Global alignment programs (GAP, NAP) http://genome.cs.mtu.edu/align/align.html • FASTA program suite http://fasta.bioch.virginia.edu/fasta/fasta_list.html • BLAST 2 sequence alignment (BLASTN, BLASTP) http://www.ncbi.nlm.nih.gov/gorf/bl2.html • Likelihood-weighted sequence alignment (lwa) http://stateslab.bioinformatics.med.umich.edu/service/lwa.html
Types of Analysis • Knowledge-based single sequence analysis for sequence characteristics • Pairwise sequence alignment • Multiple sequence alignment • Sequence motif discovery in multiple alignment • Phylogenetic inference
Sequence Alignment • Procedure for comparing two (pair wise alignment) or more (multiple sequence alignment) sequences for a series of individual characters or character patterns the are in the same order in the sequences
Sequence Alignment • Fundamental to inferring Homology (common ancestry) and function • If two sequences are in alignment-part or all of the pattern of nucleotides and polypeptides match-then they are similar and may be homologous • If sequence of a protein or other molecule ‘significantly’ matches the sequence of a protein with a known structure and function, then the molecules may share structure and function
Sequence Alignment • Pairwise Sequence Alignment • Local vs. Global Alignment • Multiple Sequence Alignment
Pairwise Sequence Alignment • One pair of elements at a time • Challenge – Find optimum alignment of 2 seqs with some degree of similarity • Optimality is based on SCORE • Score reflects the no. of paired chs in the 2 seqs and the no. and length of gaps introduced to adjust the seqs so that max no. of charaters are in alignment
Pairwise Sequence Alignment Example 1 Consider the ideal case to 2 identical nucleotide sequences Score – 1 point per pair of aligned chs. SCORE = 20 points
Pairwise Sequence Alignment Example 2 Consider the case when several of the chs are not aligned A) SCORE = 11 points?? Note that Last 6 chs are identical!!
Pairwise Sequence Alignment Example 2 contd. SCORE = 16 points?? Any cost/penalty of inserting gaps? Penalty = -0.5 / gap Final Score = 16 – 0.5*4 = 14
Pairwise Sequence Alignment Example 3 Areas of similarity and dissimilarity not obvious SCORE = 14 points
Pairwise Sequence Alignment Example 3 Areas of similarity and dissimilarity not obvious SCORE = 14 – 0.5*4 = 12 SCORE = 14 (1 for exact match) – 0.5*4 ( - 0.5 for gap) – 0.5*6 ( - 0.5 for inexact match) = 14 – 2 – 3 =9 GGTA
Pairwise Sequence Alignment Example 3 contd. SCORE = 14 – 0.5*4 – 0.5*6 (inexact matches) = 9 Penalty(gap)=Cost(opening) + Cost(ext)* Length(gap) Ex. 2 = -0.5 + (-0.5*4) = -2.5 GGTA
Local vs. Global Alignment Example 2 is GA • An attempt to line up two sequences matching as many chs as possible • Considers all chs in a seq. • Bases alignment on the total score, even at the expense of stretches that that share obvious similarity • Used for determining whether two protein seqs are in the same family
Local vs. Global Alignment • More meaningful – point out conserved regions between two sequences • Aligns two sequences of different lengths to be matched • Aligns two partially overlapping sequences • Aligns two sequences where one is a subsequence of another
Methods • Dot Matrix • Bayesian Method • Dynamic Programming • Smith-Waterman Algorithm • Hidden Markov Models • Genetic Algorithms • Neural Networks • Scoring Matrices • Word-based techniques • FASTA • BLAST
Dot Matrix Method • Visual inspection of linear sequences with 100 or more chs. is impractical • Dot Matrix method is visually more intuitive • Makes similarities in patterns more obvious to visual inspection • A dot is placed at the intersection of matching ch. pairs
Dot Matrix Method Since this is a comparison between two of the same sequences, an intra-sequence comparison, the most obvious feature is the main identity diagonal. Two short perfect palindromes can also be seen as crosses directly off the main diagonal; they are “ANA” and “SIS.”
Dot Matrix Method The biggest asset of dot matrix analysis is it allows you to visualize the entire comparison at once, not concentrating on any one ‘optimal’ region. Since your own mind and eyes are still better than computers at discerning complex visual patterns, especially when more than one pattern is being considered, you can see all these ‘less than best’ comparisons as well as the main one and then you can ‘zoom-in’ on those regions of interest using more detailed procedures.
Dot Matrix Method Here you can easily see the effect of a sequence ‘insertion’ or ‘deletion.’ It is impossible to tell whether the evolutionary event that caused the discrepancy between the two sequences was an insertion or a deletion and hence this phenomena is called an ‘indel.’ A jump or shift in the register of the main diagonal on a dotplot clearly points out the existence of an indel.
Dot Matrix Method ‘mutated’ inter-sequence comparison
Dot Matrix Method Another phenomenon that is very easy to visualize with dot matrix analysis are duplications or direct repeats. The ‘duplication’ here is seen as a distinct column of diagonals; whenever you see either a row or column of diagonals in a dotplot, you are looking at direct repeats.
Dot Matrix Method Complicated MUTATIONS Again, notice the diagonals. However, they have now been displaced off of the center diagonal of the plot and, in fact, in this example, the occurrence of a ‘transposition’ is shown. Dot matrix analysis is one of the only sensible ways to locate such transpositions in sequences. Inverted repeats still show up as perpendicular lines to the diagonals, they are just now not on the center of the plot. The ‘deletion’ of ‘PRIMER’ is shown by the lack of a corresponding diagonal.
Dot Matrix Method: Filtering Reconsider the same plot. Notice the extraneous dots that neither indicate runs of identity between the two sequences nor inverted repeats. These merely contribute ‘noise’ to the plot and are due to the ‘random’ occurrence of the letters in the sequences, the composition of the sequences themselves. How can we ‘clean up’ the plots so that this noise does not detract from our interpretations? Consider the implementation of a filtered windowing approach; a dot will only be placed if some ‘stringency’ is met. What is meant by this is that if within some defined window size, and when some defined criteria is met, then and only then, will a dot be placed at the middle of that window. Then the window is shifted one position and the entire process is repeated. This very successfully rids the plot of unwanted noise.
Word Size Algorithm T A C G G T A T G A C A G T A T C Word Size = 3 C T A T G A C A T A C G G T A T G T A C G G T A T G A C A G T A T C T A C G G T A T G A C A G T A T C T A C G G T A T G A C A G T A T C
Window/Stringency Filtering Score = 11 PTHPLASKTQILPEDLASEDLTI PTHPLAGERAIGLARLAEEDFGM Scoring Matrix Filtering Score = 11 MATRIX: PAM250 Window = 12 Stringency = 9 PTHPLASKTQILPEDLASEDLTI PTHPLAGERAIGLARLAEEDFGM Score = 7 PTHPLASKTQILPEDLASEDLTI PTHPLAGERAIGLARLAEEDFGM
C W W -8 17 PAM 250 A R N D C Q E G H I L K M F P S T W Y V B Z A 2 -2 0 0 -2 0 0 1 -1 -1 -2 -1 -1 -3 1 1 1 -6 -3 0 2 1 R -2 6 0 -1 -4 1 -1 -3 2 -2 -3 3 0 -4 0 0 -1 2 -4 -2 1 2 N 0 0 2 2 -4 1 1 0 2 -2 -3 1 -2 -3 0 1 0 -4 -2 -2 4 3 D 0 -1 2 4 -5 2 3 1 1 -2 -4 0 -3 -6 -1 0 0 -7 -4 -2 5 4 C -2 -4 -4 -5 12 -5 -5 -3 -3 -2 -6 -5 -5 -4 -3 0 -2 -8 0 -2 -3 -4 Q 0 1 1 2 -5 4 2 -1 3 -2 -2 1 -1 -5 0 -1 -1 -5 -4 -2 3 5 E 0 -1 1 3 -5 2 4 0 1 -2 -3 0 -2 -5 -1 0 0 -7 -4 -2 4 5 G 1 -3 0 1 -3 -1 0 5 -2 -3 -4 -2 -3 -5 0 1 0 -7 -5 -1 2 1 H -1 2 2 1 -3 3 1 -2 6 -2 -2 0 -2 -2 0 -1 -1 -3 0 -2 3 3 I -1 -2 -2 -2 -2 -2 -2 -3 -2 5 2 -2 2 1 -2 -1 0 -5 -1 4 -1 -1 L -2 -3 -3 -4 -6 -2 -3 -4 -2 2 6 -3 4 2 -3 -3 -2 -2 -1 2 -2 -1 K -1 3 1 0 -5 1 0 -2 0 -2 -3 5 0 -5 -1 0 0 -3 -4 -2 2 2 M -1 0 -2 -3 -5 -1 -2 -3 -2 2 4 0 6 0 -2 -2 -1 -4 -2 2 -1 0 F -3 -4 -3 -6 -4 -5 -5 -5 -2 1 2 -5 0 9 -5 -3 -3 0 7 -1 -3 -4 P 1 0 0 -1 -3 0 -1 0 0 -2 -3 -1 -2 -5 6 1 0 -6 -5 -1 1 1 S 1 0 1 0 0 -1 0 1 -1 -1 -3 0 -2 -3 1 2 1 -2 -3 -1 2 1 T 1 -1 0 0 -2 -1 0 0 -1 0 -2 0 -1 -3 0 1 3 -5 -3 0 2 1 W -6 2 -4 -7 -8 -5 -7 -7 -3 -5 -2 -3 -4 0 -6 -2 -5 17 0 -6 -4 -4 Y -3 -4 -2 -4 0 -4 -4 -5 0 -1 -1 -4 -2 7 -5 -3 -3 0 10 -2 -2 -3 V 0 -2 -2 -2 -2 -2 -2 -1 -2 4 2 -2 2 -1 -1 -1 0 -6 -2 4 0 0 B 2 1 4 5 -3 3 4 2 3 -1 -2 2 -1 -3 1 2 2 -4 -2 0 6 5 Z 1 2 3 4 -4 5 5 1 3 -1 -1 2 0 -4 1 1 1 -4 -3 0 5 6
Dotplot(Window = 130 / Stringency = 9) Hemoglobin-chain Hemoglobin -chain
Dotplot(Window = 18 / Stringency = 10) Hemoglobin-chain Hemoglobin -chain
Parameters of Sequence Alignment • Scoring Systems: • Each symbol pairing is assigned a numerical value, based on a symbol comparison table. • Gap Penalties: • Opening: The cost to introduce a gap • Extension: The cost to elongate a gap
actaccagttcatttgatacttctcaaa taccattaccgtgttaactgaaaggacttaaagact DNA Scoring Systems -very simple Sequence 1 Sequence 2 A G C T A1 0 0 0 G 0 1 0 0 C 0 0 1 0 T 0 0 0 1 Match: 1 Mismatch: 0 Score = 5
Protein Scoring Systems Sequence 1 Sequence 2 PTHPLASKTQILPEDLASEDLTI PTHPLAGERAIGLARLAEEDFGM C S T P A G N D. . C 9 S -1 4 T -1 1 5 P -3 -1 -1 7 A 0 1 0 -1 4 G -3 0 -2 -2 0 6 N -3 1 0 -2 -2 0 5 D -3 0 -1 -1 -2 -1 1 6 . . C S T P A G N D. . C 9 S -1 4 T -1 1 5 P -3 -1 -1 7 A 0 1 0 -1 4 G -3 0 -2 -2 0 6 N -3 1 0 -2 -2 0 5 D -3 0 -1 -1 -2 -1 1 6 . . Scoring matrix T:G = -2 T:T = 5 Score = 48
Scoring Insertions and Deletions A T G T A A T G C A T A T G T G G A A T G A A T G T - - A A T G C A T A T G T G G A A T G A insertion / deletion The creation of a gap is penalized with a negative score value.
Why Gap Penalties? Gaps not permitted Score: 0 1 GTGATAGACACAGACCGGTGGCATTGTGG 29 ||| | | ||| | || || | 1 GTGTCGGGAAGAGATAACTCCGATGGTTG 29 Match = 5 Mismatch = -4 Gaps allowed but not penalized Score: 88 1 GTG.ATAG.ACACAGA..CCGGT..GGCATTGTGG 29 ||| || | | | ||| || | | || || | 1 GTGTAT.GGA.AGAGATACC..TCCG..ATGGTTG 29
Why Gap Penalties? • The optimal alignment of two similar sequences is usually that which • maximizes the number of matches and • minimizes the number of gaps. • There is a tradeoff between these two • - adding gaps reduces mismatches • Permitting the insertion of arbitrarily many gaps can lead to high scoring alignments of non-homologous sequences. • Penalizing gaps forces alignments to have relatively few gaps.
Gap Penalties • How to balance gaps with mismatches? • Gaps must get a steep penalty, or else you’ll end up with nonsense alignments. • In real sequences, multi-base (or amino acid) gaps are quit common • genetic insertion/deletion events • “Affine” gap penalties give a big penalty for each new gap, but a much smaller “gap extension” penalty.
Scoring Insertions and Deletions match = 1 mismatch = 0 Total Score: 4 A T G T T A T A C T A T G T G C G T A T A Total Score: 8 - 3.2 = 4.8 A T G T - - - T A T A C T A T G T G C G T A T A Gap parameters: d = 3 (gap opening) e = 0.1 (gap extension) g = 3 (gap length) (g) = -3 - (3 -1) 0.1 = -3.2 insertion / deletion
More on Dotplots • A simple picture that gives an overview of similarity between two sequences • Its close relationship to sequence alignment is less obvious
Dot Matrix Method In a dotplot each diagonal corresponds to a possible (ungapped) alignment A T T C A C A T A T A C A T T A C G T A C Sequence 2 Sequence 1 T A C A T T A C G T A C A T A C A C T T A One possible alignment:
Dot Matrix Method T A C T G T C A T T A C T G T T C A T Sequence 2 Sequence 1 T A C T G-T C A T | | | | | | | | | T A C T G T T C A T