Download

1 / 25
260 likes | 451 Views
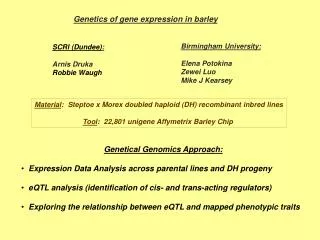
A Quantitative Overview to Gene Expression Profiling in Animal Genetics. MPSS M assively P arallel S ignature S equencing. Lynx Therapeutics, Inc, Hayward, CA. www.lynxgen.com. Armidale Animal Breeding Summer Course, UNE, Feb. 2006.

E N D
A Quantitative Overview to Gene Expression Profiling in Animal Genetics MPSS Massively Parallel Signature Sequencing Lynx Therapeutics, Inc, Hayward, CA www.lynxgen.com Armidale Animal Breeding Summer Course, UNE, Feb. 2006
A Quantitative Overview to Gene Expression Profiling in Animal Genetics MPSS Introduction • Invented by Sydney Brenner • Alternative to microarray: Counts all mRNAs in a sample • Designed to capture the complete transcriptome • High sensitivity to detect low abundance transcripts -- typical analysis involves about 1 million transcripts • Digital data that is amenable to developing large relational databases • Excellent dynamic range in excess of 100X up or down regulation • Can be applied to any organism Armidale Animal Breeding Summer Course, UNE, Feb. 2006
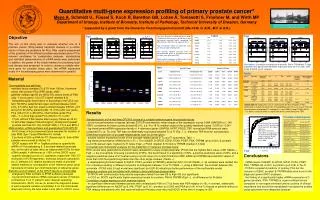
A Quantitative Overview to Gene Expression Profiling in Animal Genetics MPSS Process Overview www.lynxgen.com Armidale Animal Breeding Summer Course, UNE, Feb. 2006
A Quantitative Overview to Gene Expression Profiling in Animal Genetics MPSS Comparison to Microarray • MPSS detects virtually all mRNAs in a sample, while microarrays are limited to gene elements on the array • MPSS has greater sensitivity for routine detection of low level expressed transcripts; microarray sensitivity influenced by many factors that can be difficult to rigorously control • “Digital” data output of MPSS makes it possible to readily import data into complex relational databases; microarray data provides a ratio between an experimental and control fluorescence that is difficult to convert into values for quantitative expression levels • MPSS can be used to conduct quantitative and in-depth expression analysis on any organism, including those with a genome that has not been sequenced or studied in great detail • Microarrays have the advantage of being a high-throughput technology for analyzing large numbers of samples Armidale Animal Breeding Summer Course, UNE, Feb. 2006
A Quantitative Overview to Gene Expression Profiling in Animal Genetics MPSS Comparison to SAGE Serial Analysis of Gene Expression • Signature sequence of SAGE is 14 nucleotides compared with 17 nucleotides with MPSS: • Less ambiguity with MPSS when mapping to the mammalian genome • Easier to connect MPSS tags with known genes • Typical SAGE data set is 20,000-60,000 tags compared to over a million signatures sequences for MPSS • Lynx cloning and MPSS sequencing done on a miniaturized platform that is amenable to high-through • SAGE conducted with standard cloning and sequencing that are expensive, time consuming and labor intensive • Larger MPSS data sets provide enhanced depth of analysis Armidale Animal Breeding Summer Course, UNE, Feb. 2006
A Quantitative Overview to Gene Expression Profiling in Animal Genetics MPSS My First Impressions NB: Conservative Figures Technology $$$ cDNA 100 Affymetrix 1,000 MPSS 20,000 Armidale Animal Breeding Summer Course, UNE, Feb. 2006
A Quantitative Overview to Gene Expression Profiling in Animal Genetics Biochemist MPSS My First Impressions NB: Conservative Figures Mycroarray vs MPSS N Genes ~10,000 ~25,000 % DE Genes 2 – 10 15 – 25 N DE Genes 200 – 1,000 3,750 – 6,250 Armidale Animal Breeding Summer Course, UNE, Feb. 2006
A Quantitative Overview to Gene Expression Profiling in Animal Genetics MPSS My First Impressions • Distribution • Sensitivity • Analysis Sample 1 Sample2 p_value SIGNATURE TPM Stdev TPM Stdev GATCAAATTCATCTCTA 0 0 15 2 0.01014036 GATCAAATTGACCGCTT 8 6 23 9 0.07050718 GATCAAATTGGTGGGGG 11 18 2 2 0.08729055 GATCAAATTGTACTAGT 2 3 10 7 0.09091700 GATCAAATTGTGCAGTA 15 11 35 4 0.05020690 GATCCCGGTGTGAGGTA 124 1.2 125 1.2 0.58218485 GATCTGCCGGTGAGGTA 163 0 1650 0.62550128 ... Armidale Animal Breeding Summer Course, UNE, Feb. 2006
A Quantitative Overview to Gene Expression Profiling in Animal Genetics MPSS Test Data No Tags = 25,503 S 1 S 2 100.00 100.00 57.14 49.87 36.11 33.66 10.89 10.74 5.73 5.67 1.21 1.13 0.57 0.55 0.15 0.11 0.05 0.05 cDNA Noise Paper PNAS 02, 99:14031 100.00 56.19 36.79 11.76 6.95 1.94 1.11 0.29 0.16 MPSS My First Impressions • Empirical Distribution of Tags MPSS Paper PNAS 03, 100:4702 tpm N Tags % > 1 (0.0) 27,965 100.00 5 (0.7) 15,145 54.16 10 (1.0) 10,519 37.61 50 (1.7) 3,261 11.66 100 (2.0) 1,719 6.15 500 (2.7) 298 1.07 1,000 (3.0) 154 0.55 5,000 (3.7) 26 0.09 10,000 (4.0) 7 0.02 Armidale Animal Breeding Summer Course, UNE, Feb. 2006
A Quantitative Overview to Gene Expression Profiling in Animal Genetics MPSS My First Impressions • Empirical Distribution of Tags Armidale Animal Breeding Summer Course, UNE, Feb. 2006
A Quantitative Overview to Gene Expression Profiling in Animal Genetics 5 tpm 50 - 300 tpm MPSS My First Impressions Sensitivity Adapted from Reverter et al., 2004 Armidale Animal Breeding Summer Course, UNE, Feb. 2006
A Quantitative Overview to Gene Expression Profiling in Animal Genetics MPSS Annotation Analysis Annotation of Signatures No Tags: 25,503 • Informatives Tags • Genes hit by 1 Tag: 7,492 • Genes hit by 2 Tags: 2,232 • Genes hit by >= 3 Tags: 1,775 • Non-Informatives • Hitting a Chromosome: 1,470 • “REPEAT” (>100 hits): 1,468 • MultiGenome: 1,488 • No Hits at all: 1,439 P Values for genes >= 20 tags 2w/2b = 0.92 23% Armidale Animal Breeding Summer Course, UNE, Feb. 2006
A Quantitative Overview to Gene Expression Profiling in Animal Genetics MPSS Statistical Analysis • Categorical Data Normal approximation for Binomial proportions Armidale Animal Breeding Summer Course, UNE, Feb. 2006
A Quantitative Overview to Gene Expression Profiling in Animal Genetics MPSS Statistical Analysis Sample 1 Sample 2 Gene 1 n11 n12 N1. Others n21 n22 N2. N.1 N.2 N.. • Categorical Data Normal approximation for Binomial proportions • Fisher’s exact (?) test: • Audic & Claverie’s test: • a la SAGE data: • Man et al., 2000 • Vencio et al., 2003 No Hypothesis testing Armidale Animal Breeding Summer Course, UNE, Feb. 2006
A Quantitative Overview to Gene Expression Profiling in Animal Genetics MPSS Statistical Analysis ……an alternative Differential Gene Expression from MPSS data based on Bootstrap Percentile Confidence Intervals Presented at the International Conference on Bioinformatics 2004 – Auckland, NZ Armidale Animal Breeding Summer Course, UNE, Feb. 2006
A Quantitative Overview to Gene Expression Profiling in Animal Genetics tan-12 MPSS MPSS Test Data • 2 Issues: • Equivalence with M-A plots • Geometry Armidale Animal Breeding Summer Course, UNE, Feb. 2006
A Quantitative Overview to Gene Expression Profiling in Animal Genetics MPSS MPSS Test Data Armidale Animal Breeding Summer Course, UNE, Feb. 2006
A Quantitative Overview to Gene Expression Profiling in Animal Genetics MPSS MPSS Test Data Binomial 5,137 DE Genes Armidale Animal Breeding Summer Course, UNE, Feb. 2006
A Quantitative Overview to Gene Expression Profiling in Animal Genetics MPSS Algorithm for Bootstrap 1. Read transcripts for the i-th signature: 2. Sort MAi by ai (x-axis) 3. Define b Bins: (Same width or Same size) 4. Define rBR (Bootstrap Replicates), …enough for CI (eg. r = 200) Define (Significance) 5. For each Bjcollect 5.1. Compute: 5.2. Identify: 6. Stop Armidale Animal Breeding Summer Course, UNE, Feb. 2006
A Quantitative Overview to Gene Expression Profiling in Animal Genetics MPSS Bins of equal width Armidale Animal Breeding Summer Course, UNE, Feb. 2006
A Quantitative Overview to Gene Expression Profiling in Animal Genetics MPSS Bins of equal size • Merits: • Accuracy stabilisation • Variance stabilisation Armidale Animal Breeding Summer Course, UNE, Feb. 2006
A Quantitative Overview to Gene Expression Profiling in Animal Genetics MPSS MPSS Test Data Bootstrap CI 497 DE Genes Armidale Animal Breeding Summer Course, UNE, Feb. 2006
A Quantitative Overview to Gene Expression Profiling in Animal Genetics MPSS MPSS Test Data Armidale Animal Breeding Summer Course, UNE, Feb. 2006
A Quantitative Overview to Gene Expression Profiling in Animal Genetics MPSS Conclusions • Compared to microarray, the analysis of MPSS should be trivial • Standard parametric (binomial) methods likely to generate a large number of differentially expressed elements. • Trade-off: Biological vs Statistically significant • The proposed method possesses a number of advantages: • Very easy to implement • Very fast to generate • Operates on total transcripts as opposed to proportions • Accommodates the inherent heteroskedasticity • More research ($) is needed to assess: • The impact of MPSS in expression studies • The (possible) annotation gap (non-sequenced species) Armidale Animal Breeding Summer Course, UNE, Feb. 2006
A Quantitative Overview to Gene Expression Profiling in Animal Genetics MPSS References Brenner, S., M. Johnson, J. Bridgham, et al. (2000) Gene expression analysis by massively parallel signature sequencing (MPSS) on microbead arrays. Nature Biotechnology 18:630-634. Jongeneel, C.V., C. Iseli, B.J. Stevenson, et al. (2003) Comprehensive sampling of gene expression in human cell lines with massively parallel signature seequencing. PNAS, USA, 100:4702-4705. Man M.Z., X. Wang, and Y. Wang (2000) POWER_SAGE: comparing statistical tests for SAGE experiments. Bioinformatics, 16:953-959. Reverter, A., S. McWilliam, W. Barris, and B. Dalrymple (2004) A rapid method for computationally inferring transcriptome coverage and microarray sensitivity. Bioinformatics (in press). Tu. Y., G. Stolovitzky, and U. Klein (2002) Quantitative noise analysis for gene expression microarray experiments. PNAS, USA, 99:14031-14036. Vencio, R.Z.N., H. Brentani, and C.A.B. Pereira (2003) Using credibility intervals instead of hypothesis tests in SAGE analysis. Armidale Animal Breeding Summer Course, UNE, Feb. 2006