Quantitative Genetics
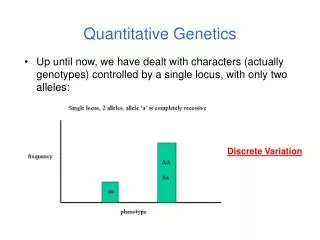
Quantitative Genetics. Chapter 25. Overview. Complex traits = characteristics that are determined by several genes and are significantly influenced by environmental factors. Quantitative traits = traits that can be described numerically.

Quantitative Genetics
E N D
Presentation Transcript
Quantitative Genetics Chapter 25
Overview Complex traits = characteristics that are determined by several genes and are significantly influenced by environmental factors. Quantitative traits = traits that can be described numerically. Quantitative genetics = the field of genetics that studies the mode of inheritance of complex or quantitative traits.
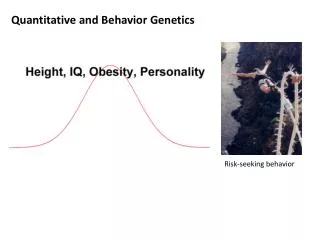
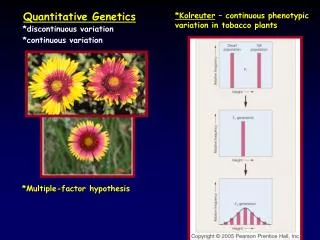
Quantitative Traits • Humans all have the same basic anatomical features (two eyes, two ears, etc.) but differ in quantitative ways. • People vary in height, weight, the shape of facial features, pigmentation, and many other characteristics.
Quantitative Traits, cont. Quantitative traits can be broken down into 4 main categories: • Anatomical • Physiological • Behavioral • Diseases
Measurement of Quantitative Traits • The measurement of quantitative traits is essential when comparing individuals or evaluating groups of individuals. • For example: it is not very informative to say that two people are tall, but if we say that one person is 6 feet 4 inches and the other is 6 feet 7 inches. ***quantitative measurement is how we describe phenotype.
Biometrics • Created in the early 1900’s by Francis Galton and his student Karl Pearson (no relation) in England. • = the statistical study of biological traits.
Example • Ears of corn have the following lengths: 15, 14, 13, 14, 15, 16, 16, 17, 15, and 15. • In genetics we are often interested in the amount of phenotypic variation that exists in a group. • A common way to evaluate variation within a population is with a statistic called the variance, which is the measure of the variation from the mean.
Variance = the sum of the squared deviations from the mean divided by degrees of freedom. Corn example: = 4(15-15)2 + 2(14-15)2 + (13-15)2 + 2(16-15)2 + (17-15)2 = 0 + 2 + 4 + 2 + 4 = 12cm2/9 = 1.33 cm2 = Variance
Standard Deviation Standard Deviation = the square root of the variance. For the corn example the variance was 1.33, so the standard deviation is 1.15 cm. See figure 25.2 on pg. 700
Discussion • Agree or Disagree: Our school grading scale should be based on the normal distribution (fig. 25.2 on pg. 700). • Write at least 1 paragraph explaining your reasoning.
Assignment • Read pg. 708-710 • Do pg. 722: C1, C3, and C7. • Copy the meanings of the following variables down in your notes: • VG • VE • VGxE • VG↔E • VT