Download
1 / 54
540 likes | 710 Views
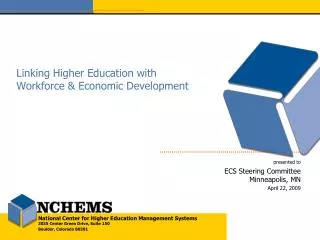
Linking Higher Education with Workforce & Economic Development. presented to ECS Steering Committee Minneapolis, MN April 22, 2009. The Pressures for Workforce Development & Increased Education Attainment. Enhanced Quality of Life – the private and public benefits of postsecondary education

E N D
Linking Higher Education withWorkforce & Economic Development presented to ECS Steering CommitteeMinneapolis, MN April 22, 2009
The Pressures for Workforce Development &Increased Education Attainment • Enhanced Quality of Life – the private and public benefits of postsecondary education • Global competitiveness • Retirement of the Baby Boomers • Increasing knowledge and skill requirements within occupations • Response to employment uncertainty/dislocations
$30,000 High Income, Low Educational Attainment High Income, High Educational Attainment CT State New Economy Index (2002) Top Tier Middle Tier NJ Low Tier MA MD $25,000 CO VA NH NY DE MN IL WA CA AK Personal Income Per Capita, 2000 NV MI RI US FL HI WI GA OH OR PA VT KS IN NC AZ $20,000 MO IA ME NE TX TN WY SC AL UT KY ND ID OK SD NM MT LA AR WV MS Low Income, Low Educational Attainment Low Income, High Educational Attainment $15,000 15% 20% 25% 30% 35% 40% Percent of Adults Age 25-64 with a Bachelor’s Degree or Higher Relationship Between Educational Attainment, Personal Income, and Economic Strength
$50,000 1980 $43,000 $36,000 AK Personal Income Per Capita CT $29,000 CA NV WY NJ HI MD NY IL CO WA DE MA MN VA US OR PA MI OH WI KS FL NH RI TX IA AZ OK IN MO $22,000 NE MT LA VT UT ID GA ME NM TN NC WV Correlation = 0.64 KY SD ND AL SC AR MS $15,000 10 15 20 25 30 35 40 45 Percent of Adults Age 25-64 with Bachelor’s Degrees Educational Attainment and Income Source: U.S. Census Bureau, Decennial Census’ and American Community Survey
$50,000 1990 $43,000 CT NJ $36,000 NY MA MD AK Personal Income Per Capita HI CA DE IL NH VA NV MN RI WA CO PA FL $29,000 US OH MI KS WI WY NE OR VT MO GA IN IA ME NC AZ TX TN OK SD ND SC AL ID MT KY LA UT NM $22,000 WV AR MS Correlation = 0.76 $15,000 10 15 20 25 30 35 40 45 Percent of Adults Age 25-64 with Bachelor’s Degrees Educational Attainment and Income Source: U.S. Census Bureau, Decennial Census’ and American Community Survey
$50,000 2000 CT NJ $43,000 MA NY MD CO NH CA MN IL $36,000 WA VA DE NV AK US PA Personal Income Per Capita RI MI FL WY WI HI OH OR GA TX KS VT NE MO IN NC IA ME TN SD $29,000 AZ ND SC OK KY UT ID AL LA MT NM WV AR MS $22,000 Correlation = 0.80 $15,000 10 15 20 25 30 35 40 45 Percent of Adults Age 25-64 with Bachelor’s Degrees Educational Attainment and Income Source: U.S. Census Bureau, Decennial Census’ and American Community Survey
$50,000 2005 CT NJ MA $43,000 MD NY NH CO MN VA WY DE CA IL $36,000 NV AK WA RI PA US HI FL WI NE KS VT SD OR MI TX OH IA Personal Income Per Capita ND MO IN NC GA ME TN AZ OK AL $29,000 MT SC ID KY NM UT AR WV MS LA $22,000 Correlation = 0.83 $15,000 10 15 20 25 30 35 40 45 Percent of Adults Age 25-64 with Bachelor’s Degrees Educational Attainment and Income Source: U.S. Census Bureau, Decennial Census’ and American Community Survey
Median Earnings for Population Age 25-64 by Education Attainment, 2006 Source: U.S. Census Bureau, 2006 American Community Survey PUMS File.
Participation in the Workforce by Level of Education, 2006 (Percent) Source: Integrated Public Use Microdata Series 5% sample
Increasing Levels of Education Attainment Lead to Improved Societal Outcomes • Increased levels of workforce participation • Decreased rates of incarceration • Improved health outcomes • Reduced participation in Medicaid and other social service programs • Greater participation in artistic, cultural, and civic pursuits • Higher levels of volunteerism and social engagement
Differences in College Attainment (Associate & Higher) Between Younger & Older Adults—U.S. & OECD Countries, 2006 Source: Organisation for Economic Co-operation and Development (OECD), Education at a Glance 2008
Differences in College Attainment (Associate & Higher) Between Younger & Older Adults—U.S., 2006 Source: U.S. Census Bureau, 2006 American Community Survey (ACS)
Percent of Adults with an Associate Degree or Higher by Age Group - U.S. & Leading OECD Countries Source: OECD, Education at a Glance 2008
Closing the Gap – Number of Degrees Required Beyond Current Production
Educational Attainment (Percent) Current, in 2025 with current degree production, and best-performing countries in 2025
Reaching Top Performance by 2025 (55%) – United States 94,510,473 31,382,831 63,127,642 40,605,747 7,045,932 15,626,080 781,304 52.8% Number of Individuals to Match Best-Performing Countries (55%) Number of Individuals (Age 25-44) Who Already Have Degrees Additional Degree Production Needed (2005 to 2025) Degrees Produced at Current Annual Rate of Production Additional Residents with College Degrees from Net Migration Additional Degrees Needed Additional Degrees Needed per Year (Currently Produce 2,135,924 in All Sectors) Increase in Annual Associate and Bachelor’s Degree Production Needed (in Public Sector Only)
Degrees Produced 2005-25 with Current Rate of Production Additional Degrees from Population Growth Additional Degrees from Net Migration of College-Educated Residents Reaching Best Performance in High School Graduation Rates by 2025 Reaching Best Performance in College-Going Rates by 2025 Reaching Best Performance in Rates of Degree Production per FTE Student Total Degrees Produced 2005-25 If All of the Above Degrees Needed to Meet Best Performance (55%) Pipeline Performance Is Cumulative How Can the U.S. Reach International Competitiveness? Current Degree Production Combined with Population Growth and Migration and Improved Performance on the Student Pipeline Measures Source: 2005 ACS, PUMS
Percent of Population Age 25-64 with an Associate Degree or Higher, 2006 Benchmark for International Competitiveness (55%) Source: U.S. Census Bureau, 2006 ACS
140,533 94,162 131,749 Massachusetts North Dakota Rhode Island New York Nebraska Colorado Iowa Utah The “Gap” - Difference in Annual Degrees Currently Produced and Annual Degrees Needed to Meet Benchmark Accounting for Migration U.S. = 781,301 (a 52.8% increase in the public sector) Source: U.S. Census Bureau, PUMS and Population Projections, IPEDS Completions Survey 2004-05
Texas 1,333,645 Florida 893,504 California 560,688 New Jersey 320,720 Tennessee 307,956 Nevada 287,565 Louisiana 204,814 Arkansas 186,640 Kentucky 159,765 North Carolina 132,748 Arizona 122,061 Mississippi 115,120 Ohio 114,375 South Carolina 112,681 Alabama 110,495 West Virginia 74,752 Alaska 65,853 Oklahoma 62,332 Oregon 53,995 Michigan 53,574 New Mexico 47,420 Wisconsin 44,757 Maine 39,436 Idaho 37,706 Montana 34,547 Hawaii 28,659 Georgia 25,326 Wyoming 24,741 Maryland 23,542 Connecticut 10,875 Missouri 8,898 Indiana 2,788 0 300,000 600,000 900,000 1,200,000 1,500,000 Even Best Performance with Traditional College-Aged Students at Each Stage of the Educational Pipeline Will Leave Gaps in More than 30 States In order to reach international competitiveness by 2025, the U.S. and 32 states can’t close the gap with even best performance with traditional college students. They must rely on the re-entry pipeline – getting older adults back into the education system and on track to attaining college degrees.
Projected Change in Population from 2005 to 2025, Ages 25-64 3,236,902 U.S. = +15,821,162 Maine New Mexico Oklahoma Kansas Hawaii Wyoming South Dakota Connecticut North Dakota Louisiana Massachusetts Illinois Nebraska Alabama Iowa West Virginia Pennsylvania Ohio New York -393,267 Source: U.S. Census Bureau State Population Projections
17.5 The majority of expected growth in the younger population is among segments of the population with the lowest levels of education, while whites are projected to decline. Projected Change in U.S. Population by Age and Race/Ethnicity, 2005 to 2025 (In Millions) Note: Projections based on 2000 Census are not available for Native Americans. Source: U.S. Census Bureau, Population Projections based on 2000 Decennial Census
Change in Population Age 25-44 By Race/Ethnicity, 2005-2025 …2,689,700 …1,044,516 Source: U.S. Census Bureau
White African-American Hispanic/Latino Native American/AK Native Asian/Pacific Islander Males Males Males Males Males Females Females Females Females Females Bachelor's Degree or Higher All College Degrees (Associate or Higher) Norway Canada U.S. Index = 87% U.S. Index = 72% Educational Attainment of Young Workforce (Age 25-34) Indexed to Most Educated Country, 2007 Source: U.S. Census Bureau 2005-2007 American Community Survey; OECD
Percent of Adults with an Associate Degree or Higher, 2005 Source: U.S. Bureau of Justice Statistics 2002 data, U.S. Census Bureau 2005 data
The Population of Young AdultsNot Enrolled in School or College, 2007 Total: 35,417,000 Source: American Community Survey
Adult Education and LiteracyTarget Population, 2005 Target Population (Exclusive Categories) Age 18-64 ESL: High school diploma only or less—no or poor ability to speak English 8,339,734 Not Prepared for College or Work: High school diploma only, in families earning less than a living wage (not ESL) 14,494,128 Target Population 42,357,936 (23.5%) 138,127,986 No High School Diploma or Equivalent (not ESL) 19,524,074 Note: Incarcerated population not separated out. Source: U.S. Census Bureau, 2005 ACS; PUMS
Adult Education & LiteracyTarget Populations as a Percentage of All Adults Age 18-64, 2005 Source: U.S. Census Bureau, 2005 ACS; PUMSNote: Incarcerated population not separated out.
2,579,656 1,274,890 Number of Adults Age 18-64 Who Speak English Poorly or Not at All by State, 2005 U.S. = 8,339,734 Source: U.S. Census Bureau, 2005 ACS
Number of U.S. Residents Age 18-64 Who Speak English Poorly or Not at All, By Level of Education Completed, 2005 U.S. = 8,339,734 Source: U.S. Census Bureau, 2005 ACS
Percent of Population Age 18-64 with Less than a High School Diploma (or Equivalent), 2005 Source: U.S. Census Bureau, 2005 ACS
3,707,705 3,038,986 Number of Adults Age 18-64 with Only a High School Diploma or Less in Families with Incomes Below a Living Wage* by State, 2005 U.S. = 28,770,543 *200% of Poverty Level Source: U.S. Census Bureau, 2005 ACS
Number of U.S. Residents Age 18-64 in Families with Incomes Below a Living Wage, By Education Level Completed, 2005 U.S. = 28,770,543 Source: U.S. Census Bureau, 2005 ACS
Proportion of Residents Age 18-64 in Families with Incomes Below a Living Wage within Each Education Attainment Category, 2005 Source: U.S. Census Bureau, 2005 ACS
Enrollment in State-Administered Adult Education Programs per 1,000 Residents with Less than a High School Diploma By Age Group, 2005 (U.S.) *Age 16-24 with no high school diploma or equivalent, not enrolled Source: U.S. Department of Education
Enrollment of Residents Age 16-24 in State-AdministeredAdult Education Programs per 1,000 Residents Age 16-24 with Less than a High School Diploma, 2005 *Age 16-24 with no high school diploma or equivalent, not enrolled Source: U.S. Department of Education
Enrollment of Residents Age 25-44 in State-Administered Adult Education Programs per 1,000 Residents Age 25-44 with Less than a High School Diploma, 2005 Source: U.S. Department of Education
84.5 GEDs Awarded per 1,000 Adults with Less than a High School Diploma or Equivalent by Age Group, 2005 (U.S.) *Age 16-24 with no high school diploma or equivalent, not enrolled Source: GED Testing Service, U.S. Census Bureau, 2005 ACS
340 GEDs Awarded to Adults Age 16-24 per 1,000 Adults Age 16-24* with Less than a High School Diploma or Equivalent, 2005 *Age 16-24 with no high school diploma or equivalent, not enrolled Source: GED Testing Service, U.S. Census Bureau, 2005 ACS
GEDs Awarded to Adults Age 25-34 per 1,000 Adults Age 25-34 with Less than a High School Diploma or Equivalent, 2005 Source: GED Testing Service, U.S. Census Bureau, 2005 ACS
Age: Distribution of GEDs Awarded by Age Group, 1990 and 2005 (Percent) Source: GED Testing Service
40.1 College Enrollment of Residents Age 25-49 as a Percentage of Residents Age 25-49 with a High School Diploma but No College, 2005 Source: NCES, IPEDS Enrollment Survey; U.S. Census Bureau 2005 ACS
Barriers to Adult Participation & Completion • Prior preparation – absence of basic skills • Time • Life happens • Courses scheduled to benefit faculty & 18 year-olds • End point is discouragingly far away • Cost • Out-of-pocket • Opportunity • Relevance • Motivation
Remedies • A vastly improved approach to remedial/developmental education • More fine-grained assessment of deficiencies • Modularized instruction • Use of technology • A workplace oriented approach (e.g., WorkKeys and KeyTrain) • Providing short-term benefits • Work readiness certificates • Career pathways • Stackable certificates • Assessments that translate into credit for prior learning • Employers “pulling” the need for education • Student aid geared to adult, part-time students • Earn & Learn