Download
1 / 47
480 likes | 661 Views
A pipeline for fingerprinting data analysis. DiMI. University of Udine. Simone Scalabrin. Department of Matemathics and Computer Science. Physical Map. Set of contigs Each contig is a set of partially overlapping genomic clones Minimal tiling path. B. BAC clone. Digestion.

E N D
A pipeline for fingerprinting data analysis DiMI University of Udine Simone Scalabrin Department of Matemathics and Computer Science
Physical Map Set of contigs Each contig is a set of partially overlapping genomic clones Minimal tiling path
B BAC clone Digestion Separation Detection Band calling 20,000 bp 10,000 bp 4,500 bp 4,000 bp 2,000 bp 1,200 bp 800 bp BAC clone library, 7-30 genome equivalents, inserts produced with one or more restriction enzymes A C Pairwise comparisons High-stringency Assembly E D Verification & Map Alignment Low-stringency And Manual Re-assembly Meyers, Scalabrin, Morgante 2004 Nature Reviews Genetics, 2004
A pipeline for fingerprinting preculture culture miniprep fingerprint sequencer
Process and people A B B A C Samples 1600 1600 1600 1600 1600 • Day 1: cellular preculture • Day 2: cellular culture • Day 3: DNA isolation (miniprep) • Day 4: DNA fragmentation • Day 5: separation on sequencer All 5 phases were carried on in parallel leading to 8000 DNA samples processed weekly by 3 people
Automation 48 DNA samples every 35 minutes, 2000 per day Almost everything automated
DNA fingerprinting of BAC clones. B BAC clone Digestion Separation Detection Band calling 20,000 bp 10,000 bp 4,500 bp 4,000 bp 2,000 bp 1,200 bp 800 bp
Blunt end enzymes 5’AATGCATAGTACACATGTACTACAGATACGTACACAT 3’ 3’TTACGTATCATGTGTACATGATGTCTATGCATGTGTA 5’ Blunt ends
Blunt end cut 5’AATGCATAGT 3’ 5’ACACAT 3’ 3’TTACGTATCA 5’ 3’TGTGTA 5’ 5’ACACATGTACTACAGATACGT 3’ 3’TGTGTACATGATGTCTATGCA 5’
Sticky end enzymes 5’ACTGAATGCATACTTAAGACATAGAGT 3’ 3’TGACTTACGTATGAATTCTGTATCTCA 5’ Sticky ends
Sticky end cut 5’ACTGAATGCATACT 3’ 5’TAAGACATAGAGT 3’ 3’TGACTTACGTATGAAT 5’ 3’TCTGTATCTCA 5’
Fluorescent fingerprinting 5’ACTGAATGCATACTT 3’ 3’TGACTTACGTATGAAT 5’ Different dyes
Markers VV132 VV132 How to detect overlaps
VV132 VV132 How to detect overlaps Markers
How to detect overlaps Markers VV132
How to detect overlaps Markers VV132 Fingerprinting EcoRI
How to detect overlaps Markers VV132 Fingerprinting
How to detect overlaps Markers VV132 Fingerprinting
How to detect overlaps Markers VV132 Fingerprinting
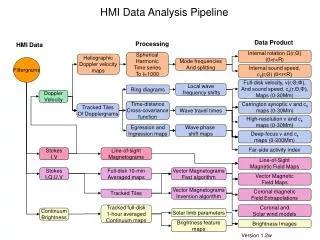
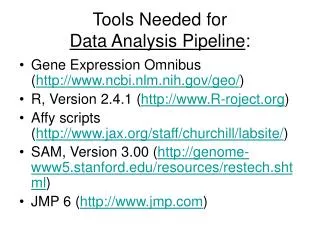
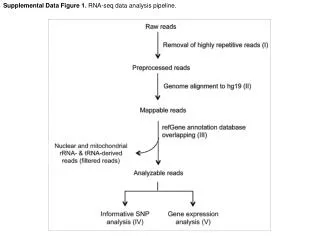
Data Analisys SOFTWARE ACTIVITIES Electrochromatograms ABI Prism 3730 Peaks detection GeneMapper Background and vector removal Script in PERL Genoprofiler Contigs assembly FPC
Peaks detection Tabular text table (GeneMapper)
Electrochromatograms Composition (per color/dye): • At least 200 peaks • 30 – 50 true bands (as expected from previous simulations) • Minimum height
Threshold BACKGROUND REMOVAL True bands Background
f(avg) Background Removal (1)
Genoprofiler 1.10 http://wheat.pw.usda.gov/PhysicalMapping/tools/genoprofiler/genoprofiler.html
f(ratio) Background Removal 2 Scalabrin and Morgante
UA UA UL UL end LL LL LA LA Background Removal 3 IG = UA1 – LA1 UL = UA – 0,3 * IG LL = LA + 0,15 * IG Scalabrin and Morgante Perl script
Electrochromatograms → text • Divide by colors • High sensibility (FPC deals with integers 0-64k) • 4 dyes → 4 zones 50 500 50 500 50 500 50 500 0 15000 30000 45000 60000
Electrochromatograms → text 1028_B10 14 1526,7 1739,1 5867,4 6664,5 7170,6 7319,1 16500,0 18532,8 20370,9 20919,6 21139,5 22703,7 24783,3 50414,1 BLUE GREEN RED
Automated assembly Pairwise comparisons High-stringency Assembly
FALSE POSITIVE Fingerprinting Techniques A B A B Digestion with Fluorescence Simple Digestion
http://www.agcol.arizona.edu/software/fpcFPC 8.1 Basics - FingerPrinted Contigs - Designed for restriction digest fingerprints - Assembles clones into contigs in 2 steps: 1) Clustering- based on the # of shared bands 2) Ordering- finds best solution to maximize overlap Two Key Parameters Tolerance = bin size Cutoff: probability that the match between any 2 BAC clones is due to chance alone (and not a real overlap) Lower cutoff: higher stringency in the assembly
nL [ ] ( ) å - nL m nL m - (( 1 p ) p ) m = m M Statistics to build the map Sulston cutoff score where nL and nH are the min and max number of bands among the two clones and M is the minimum number of shared bands, p =(1-b)nH, b=2t/gellen, t is the tolerance, gellen. t t 0 60000=gellen b represents the probability that one band of one clone matches with another band of the other clone. p represents the probability that none of the nH bands of the “bigger” clone match with a single band of the “smaller” clone.
CB Maps FPC tries to order clones based on Consensus Bands Clone order Clone name Bands Extra bands + = shared band o = missing band x = 2 tolerance bin
Q Clones Qs: enough shared bands to cluster into a contig, but do not fit nicely into a CB map (many extra bands) 4 Types of Qs 1) Bad fingerprint 2) Clone doesn’t belong there -duplicated,repetitive region 3) Suboptimal solution 4) Allelic diversity
Manual curation and assembly Low-stringency And Manual Re-assembly
Confirmation of contigs: Fingerprinting with a second enzyme Fingerprinting of 15 contigs with a second set of enzymes • Contigs are unchanged (cut-off)? • Confirming linear order of BACs within contig
Genetic and Physical Map Integration Chr10 GR0568 0,0 GR0176 7,2 BA0025 17,6 BA0003 21,1 F20236b 21,8 IN0126 23,4 GR0409 24,4 GR0280 25,5 F20681 26,1 E39/M49-114 26,7 E32/M62-282 30,5 F20236a 33,7
Linking of Physical Map to Genetic Map • How many contigs from the physical map? • in theory one per chromosome • a realistic goal is around 2000 (in the grapevine project) • Each contig needs to be linked to the genetic map • 1 marker per contig provides position • 2 markers per contig provide orientation
Heterozygosity impact 1200 CBu 2200 CBu 50% shared fragments 50% shared fragments and 4 clones of type B missing
Acknowledgements • Prof. Michele Morgante • Doct. Riccardo Velasco • Doct. Marco Moroldo • Prof. Alberto Policriti • Doct. Giacomo Prete • Doct. Raffaella Marconi • Doct. Nicoletta Felice • Doct. Massimo Pindo • Doct. Michela Troggio • Doct. Cinzia Segala • Doct. Paolo Fontana
Literature • Mapping and sequencing complex genomes: Let’s get physical!, Meyers, Scalabrin, Morgante, Nature Reviews Genetics, 2004 • FPC: a system for building contigs from restriction fingerprinted clones, Soderlund, Longden, Mott, 1997 • Whole-Genome Validation of High-Information-Content Fingerprinting, Nelson, Soderlund et al. 2005 • Mapping Sequence to Rice FPC, Soderlund, Wing et al.2005