Download

1 / 23
230 likes | 250 Views
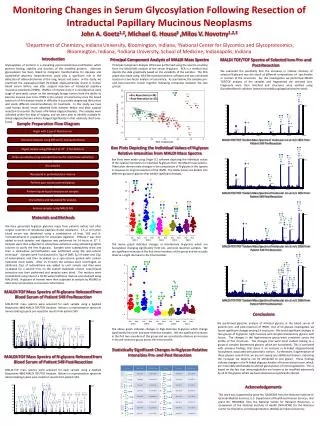
This study focuses on predicting costs under alternative designs in a responsive survey design framework using machine learning models, such as Multilevel Regression Models and Bayesian Additive Regression Trees, based on data from the National Survey of Family Growth. The research aims to improve the accuracy of cost predictions by utilizing incoming data and paradata to address uncertainties in survey design. By analyzing data from multiple phases of the NSFG, the study compares different prediction methods to optimize cost estimates and reduce errors.

E N D
Using Machine Learning Models to Predict Costs under Alternative Designs in a Responsive Design Framework 1 Survey Research Center, Institute for Social Research, Univ. of MI-Ann Arbor 2 Joint Program in Survey Methodology, Univ. of MD-College Park 3 U.S. Census Bureau James Wagner1,2, Michael Elliott1,2,3, Brady T. West1,2, Stephanie Coffey2,3 ESRA July 18, 2019
Acknowledgements / Disclaimers • This work was supported by a grant from the National Institutes for Health (#1R01AG058599-01; PI: Wagner) • The National Survey of Family Growth (NSFG) is conducted by the Centers for Disease Control and Prevention's (CDC’s) National Center for Health Statistics (NCHS), under contract # 200‐2010‐33976 with University of Michigan’s Institute for Social Research with funding from several agencies of the U.S. Department of Health and Human Services, including CDC/NCHS, the National Institute of Child Health and Human Development (NICHD), the Office of Population Affairs (OPA), and others listed on the NSFG webpage (see http://www.cdc.gov/nchs/nsfg/). The views expressed here do not represent those of NCHS or the other funding agencies.
Overview • Background • Responsive Survey Design • Monitoring incoming data from the field • Problem • Need predictions of costs under alternative designs • NSFG • Current design • Data • Methods • Multilevel Regression Models • Bayesian Additive Regression Trees (BART) • Results • Conclusions
Responsive Survey Design (RSD) • Uncertainty has become an issue in survey design • RSD makes use of incoming data from the field to address this uncertainty • Groves and Heeringa (2006) • Develop indicators of cost and error • Planned interventions when costs increase or errors stabilize/increase
Problem • Costs and errors vary over time • RSD has used proxy indicators • Costs: call attempts • Nonresponse error: stabilized estimates, “phase capacity” • Inaccurate indicators may lead to inefficient designs • Can we improve the accuracy of cost predictions?
NSFG • Continuous data collection • A new sample is released every quarter • Two-stage data collection: • Screener interview to identify eligible persons • Main interview of selected person • Two phases of data collection: • Phase 1: 10 week data collection • Phase 2: Subsample remaining cases • Oversample higher likelihood of interview cases and eligible/likely eligible cases • Reduce interviewer workload by 2/3 • Change data collection model: added interview token of appreciation, interviewer behavior change • Combine data and response rates from two phases using weights
NSFG: Data • We use the data available at the time the predictions would be made • Paradata: highly correlated with interviewer hours (Wagner, 2019) • Paradata and other characteristics of the sample for the future time periods we are predicting are not available at time of prediction • Use lagged values: the values from two weeks prior to the time period being predicted
NSFG: Data • Data include: • Interviewer ID • Phase (i.e. the design change) • Lagged values of the following: • Area characteristics: Census Division, Population eligibility rate, urbanicity, etc. • Interviewer observations: access problems, safety concerns, etc. • Commercial data: Age of first person, etc. • Paradata: Number of screened interviews, number of trips, number of active lines, etc.
NSFG: Data • Variables are summarized to the interviewer-week level • Call attempts have sample characteristics, interviewer observations, etc. • Categorical variables: Mode • EXAMPLE: Modal urbanicity from cases that were attempted two weeks prior to the week being predicted • Continuous variables: Mean • EXAMPLE: Mean population eligibility rate from cases that were attempted two weeks prior • Paradata: Sums • EXAMPLE: Number of completed screening interviews two weeks prior to the week being predicted • EXAMPLE: Number of active sampled units (“lines”) two weeks prior
NSFG: Data • Use data from previous quarters and current quarter phase one to predict phase two costs • Predictions for Q22-Q27 • Outcome variable: phase two interviewer hours • This is the major cost driver of the phase • Secondary costs: incentives • Not predicted in these models • Some are prepaid, i.e. known • Postpaid incentive more readily predicted from propensity models
Method • Two methods of prediction: • Multilevel regression models • Random intercept for each interviewer • All covariates described earlier included in the model • Bayesian Additive Regression Trees (BART, Chipman, et al., 2010) • Sum of trees method • Priors constrain the inclusion of predictors • Possible to examine how frequently each predictor is included
Method • Compare: • Total Predicted vs observed hours in phase 2 • Interviewer-level predicted vs observed hours in phase 2 • Measures of accuracy • Mean squared error: • Mean absolute error:
Results: Interviewers are consistent • MLM models: ICC:0.21-0.25 • BART models: 20 most frequently included variables • 11 are interviewer IDs
Conclusions • Cost prediction is an interesting problem • Existing methods for prediction can be used • In this problem, knowing the interviewer is very useful since their behavior is consistent • For this problem, MLM and BART models produce comparable predictive accuracy
Thank You! • Email: jameswag@umich.edu
References • Chipman, H. A., E. I. George and R. E. McCulloch (2010). "BART: Bayesian additive regression trees." The Annals of Applied Statistics4(1): 266-298. • Groves, R. M. and S. G. Heeringa (2006). "Responsive design for household surveys: tools for actively controlling survey errors and costs." Journal of the Royal Statistical Society: Series A (Statistics in Society)169(3): 439-457. • Wagner, J. (2019). "Estimation of Survey Cost Parameters Using Paradata." Survey Practice12(1): 1-10.