Download
1 / 12
120 likes | 143 Views
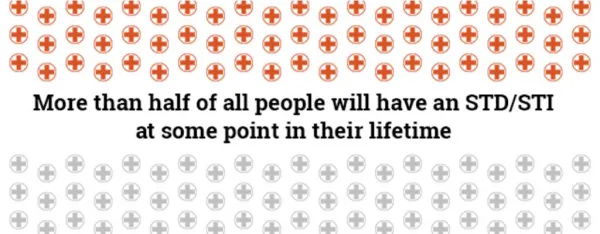
Explore 2018 STD surveillance data on chlamydia, gonorrhea, pelvic inflammatory disease, ectopic pregnancy, and syphilis among females and infants in the United States. Detailed rates and trends are presented.

E N D
Division of STD Prevention Sexually Transmitted Disease STDs in Women and Infants Surveillance 2018
Chlamydia — Rates of Reported Cases Among Females by State and Territory, United States, 2018 * Per 100,000. NOTE: See Sections A1.11 in the Appendix for more information on interpreting reported rates in US territories.
Chlamydia — Positivity Among Females Aged 14–39 Years by Race/Hispanic Ethnicity and Age Group in Clinics* Providing Family Planning and Reproductive Health Services, STD Surveillance Network (SSuN), 2018 * Includes clinics (n=26) that tested >100 females for chlamydia in 2018 and testing coverage was >60%. NOTE: See section A2.2 in the Appendix for SSuN methods.
Gonorrhea — Rates of Reported Cases Among Females by State and Territory, United States, 2018 * Per 100,000. NOTE: See Sections A1.11 in the Appendix for more information on interpreting reported rates in US territories.
Pelvic Inflammatory Disease — Initial Visits to Physicians’ Offices Among Females Aged 15–44 Years, United States, 2007–2016 * In thousands. NOTE: The relative standard errors for these estimates are 23%–16%. See section A2.5 in the Appendix and Table 44. SOURCE: National Disease and Therapeutic Index, IMS Health, Integrated Promotional Services™, IMS Health Report, 1966–2016.
Estimated Percentage of Acute Pelvic Inflammatory Disease Emergency Department Visits Among Females Aged 15–44 Years by Age Group and Year, United States, 2006–2013 SOURCE: Kreisel, K, Flagg, EW, Torrone E. Trends in pelvic inflammatory disease emergency department visits, United States, 2006–2013. Am J Obstet Gynecol. 2018;218(1):117.e1–117.e10.
Pelvic Inflammatory Disease — National Estimates of Lifetime Prevalence Among Sexually-Experienced Women Aged 18–44 Years by Race/Hispanic Ethnicity and Previous STD Diagnosis, National Health and Nutrition Examination Survey (NHANES), 2013–2014 NOTE: Error bars indicate 95% confidence intervals. Prevalence estimates among non-Hispanic Black women with a previous STD diagnosis have a relative standard error >40% but <50%. SOURCE: Kreisel, K, Torrone, E, Bernstein, K, et al. Prevalence of pelvic inflammatory disease in sexually experienced women of reproductive age — United States, 2013–2014. MMWR Morb Mortal Wkly Rep. 2017;66(3):80–83.
Ectopic Pregnancy — Ratio* Among Commercially Insured Females with Live Births Aged 15–44 Years by Age Group, 2006–2017 * Ratios represent the number of ectopic pregnancy diagnoses per 100,000 live births. SOURCE: MarketScan Commercial Claims and Encounters Database, Truven Health Analytics, Ann Arbor, MI, 2006–2017.
Chlamydia and Gonorrhea — Rates of Reported Cases Among Infants <1 Year of Age by Year and Specimen Source, United States, 2014–2018 * Per 100,000 live births. † Includes cases with specimen source reported as missing, unknown, or other. ADAPTED FROM: Kreisel K, Weston E, Braxton J, et al. Keeping an eye on chlamydia and gonorrhea conjunctivitis in infants in the United States, 2010–2015. Sex Transm Dis. 2017;44(6):356–358. ACRONYMS: CT = Chlamydia; GC = Gonorrhea.
Congenital Syphilis — Rates of Reported Cases by State and Territory, United States, 2018 * Per 100,000 live births. NOTE: See Section A1.11 in the Appendix for more information on interpreting rates for US territories.
Primary and Secondary Syphilis — Rates of Reported Cases Among Females by State and Territory, United States, 2018 * Per 100,000. NOTE: See Sections A1.11 in the Appendix for more information on interpreting reported rates in US territories.