Download
1 / 30
300 likes | 520 Views
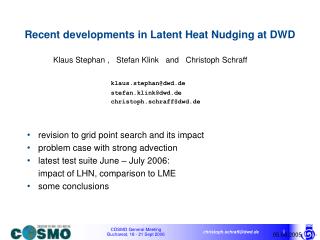
Recent developments in Latent Heat Nudging at DWD. Stefan Klink, Klaus Stephan and Christoph Schraff stefan.klink@dwd.de klaus.stephan@dwd.de christoph.schraff@dwd.de. “blacklist” for radar data latent heat nudging and “prognostic” precipitation

E N D
Recent developments in Latent Heat Nudging at DWD Stefan Klink, Klaus Stephan and Christoph Schraff stefan.klink@dwd.de klaus.stephan@dwd.de christoph.schraff@dwd.de • “blacklist” for radar data • latent heat nudging and “prognostic” precipitation • results of assimilation experiments • summary and aspects of future work 05.08.2005 - 1 -
Motivation: detection of ground clutter, which is not removed by the operational Doppler filter, clutter occurs at many of these grid points more or less permanently “Blacklist” for radar data total sum of precipitation derived from the DX radar composite • approach: consistency of radar derived precipitation rate and satellite derived cloud-type product (Met-8 Nowcasting-SAF) at each grid point over a longer time period (e.g. 15 days) • blacklist criterion: at 20% of the cloud-free dates, a non-zero precipitation rate has to be found at this special grid point • Usage during assimilation: blacklisted grid points are not treated by the LHN-algorithm • Plan: update this mask once a month, taking at least the last 30 days into consideration 05.08.2005 - 2 -
Hourly accumulated precipitation height 05.08.2005 - 4 -
test case with “prognostic” precipitation Hourly accumulated precipitation height 05.08.2005 - 5 -
“Prognostic” Precipitation prognostic diagnostic • full prognostic equation for the mass fraction : • just a diagnostic expression for the precipitation flux : • precipitation falls immediately and in the same column, in which it has been formed. • t = 0 ; xy = 0 • precipitation falls with a certain sedimentation velocity through the model space and could be advected horizontally , too. • t > 0 ; xy 0 05.08.2005 - 6 -
55km y x Latent heat nudging and “prognostic” precipitation LHN-Assumption: vertically integrated latent heat release precipitation rate The correlation between the vertically integrated rate of latent heat release and the surface precipitation rate is significantly smaller in the simulation with prognostic precipitation 05.08.2005 - 7 -
The precipitation rate reflects the integral of latent heat release along the path of precipitation particles through the atmosphere from the formation of cloud droplets • until the contact with the ground. prognostic diagnostic • Integration within one column • Integration along a path 05.08.2005 - 8 -
+ - • main part of positive latent heat release occurs in updrafts, • strong precipitation rates are often related to downdrafts • at x < 3 km , with prognostic treatment of precipitation (model resolves large clouds): • model is able to distinguish between updrafts and downdrafts inside convective systems • horizontal displacement of areas with strong latent heating resp. to surface precipitation, modified spatial structure of latent heat release in the model • scheme will notice only with temporal delay if precipitation already activated by LHN from: R. A. Houze, Jr.: Cloud Dynamics International Geophysics Series Vol. 53 05.08.2005 - 9 -
possible adaptations I • horizontal displacement of verticallyintegrated latent heating and surface precip.: • strong horizontal smoothingapplied to 2D fields of observed and modelled surface precipitation rate and to 3D field of latent heat release,in order to get higher correlation of precipitation and latent heating • (is found to have limited impact, tends to decrease precipitation amounts) 05.08.2005 - 10 -
possible adaptations II • change of the spatial structure of latent heat release in the model: • updraft regions (at the leading edge of a convective cell): very high values of latent heat release, little precipitation • higher values of the scaling factor and of LHN increments often occur • reduce upper limit of the scaling factor • adapt grid point search routine • downdraft regions (further upstream): high precipitation rate, weak latent heat release (often negative in most vertical layers) • LHN increments are inserted only in the vertical layers where the model latent heating rates are positive (approx. in cloudy layers) (to avoid e.g. negative LHN increments and cooling where the precipitation rate should be increased) 05.08.2005 - 11 -
vertically averaged precipitation flux (more consistent, however it does not eliminate the temporal delay completely) • for LHN: temporal delay effect found to be much more important than spatial displacement • possible adaptations III: • temporal delay effect (generated precipitation reaches the ground with some delay): • an immediate reference information, on how much precipitation the temperature increment has initialised already, is required within each time step • use of a ’reference precipitation’RRref: • diagnostically calculated precipitation rate (by additional call of diagnostic precipitation scheme without any feedback • on other model variables) 05.08.2005 - 12 -
Experiment for 07 – 18 July 2004 (mainly convective precipitation events) • Model setup: • general settings • LM version 3.13 • LMK configurations (2-TL-scheme, SL advection scheme) • continuous assimilation cycle, 00-, 12-, 18- UTC forecasts • LHN experiment • ‘undelayed’ reference precipitation (vertically averaged precipitation flux) • applying temperature increments ‘only in clouds’ • upper limit of scaling factor = 2, lower limit = 0.5 • analysed 3D precipitation fields not passed to the forecasts • laterally nested into GME • CTRL experiment • laterally nested into LM 05.08.2005 - 13 -
Hourly accumulated precipitation height 05.08.2005 - 14 -
Hourly accumulated precipitation height 05.08.2005 - 15 -
Hourly accumulated precipitation height 05.08.2005 - 16 -
12 UTC forecasts, ETS precipitation (hourly heights), threshold values: 0.1, 0.5, 1.0, 5.0 mm 0.5 0.1 5.0 1.0 05.08.2005 - 17 -
Assimilation, FBI precipitation (hourly heights), threshold values: 0.1, 0.5, 1.0, 5.0 mm 0.5 0.1 5.0 1.0 05.08.2005 - 18 -
result of a 4-day intermediate experiment: FBI for 5.0 mm threshold during assimilation (LM 3.13, nested into GME): revised version decreases overestimation of precipitation compared to previous LHN version • Experiment for 07 – 18 July 2004 (mainly convective precipitation events) • Model setup: • general settings • LM version 3.15 • new LMK configurations (2-TL-scheme, Bott advection scheme) • continuous assimilation cycle, 00-, 12-, 18- UTC forecasts • LHN experiment • ‘undelayed’ reference precipitation (vertically averaged precipitation flux) • applying temperature increments ‘only in clouds’ • upper limit of scaling factor = 1.7, lower limit = 0.3, + logarithmic scaling • analysed 3D precipitation fields passed to the forecasts • laterally nested into LM • CTRL experiment • laterally nested into LM 05.08.2005 - 19 -
scores for hourly precipitation : with latent heat nudging / without latent heat nudging assimilation 0.1mm threshold values 2.0mm ETS FBI 05.08.2005 - 20 -
scores for hourly precipitation : with latent heat nudging / without latent heat nudging 12-UTC forecasts 0.1mm threshold values 2.0mm ETS FBI … and similar results for 18-UTC forecasts 05.08.2005 - 21 -
scores for hourly precipitation : with latent heat nudging / without latent heat nudging 18-UTC forecasts 0.1mm threshold values 2.0mm ETS FBI … and similar results for 18-UTC forecasts 05.08.2005 - 22 -
scores for hourly precipitation : with latent heat nudging / without latent heat nudging 0-UTC forecasts 0.1mm threshold values 2.0mm ETS FBI 05.08.2005 - 23 -
moister drier more stable colder verification against German radiosondes, 11-day period (8 – 18 July 2004): dashed: with latent heat nudging / solid: without latent heat nudging bias +0h +6h +12h +18h relative humidity temperature 05.08.2005 - 24 -
verification against German radiosondes, 11-day period (8 – 18 July 2004): dashed: with latent heat nudging / solid: without latent heat nudging r m s e +0h +6h +12h +18h r e l a t I v e h u m I d I t y t e m p e r a t u r e worse better 05.08.2005 - 25 -
Summary of Results • ‘blacklist’ for radar data: avoids introduction of spurious rain at radar locations • several adaptations to LHN to cope with prognostic precipitation; most important: use of an ‘undelayed’ reference precipitation (vertically averaged precipitation flux) • revised LHN, assimilation mode: • simulated rain patterns in good agreement with radar observations, • overestimation of precipitation strongly reduced • strong gravity waves induced LHN forcing too strong (?) • subsequent forecasts, impact on precipitation (10-day summer period): • large positive impact for 4 hours (longer than insimulations with diagnostic precip) • mixed ETS impact beyond + 6 h (interpretation yet unclear, need verification without ‘double penalty’) • frequency bias slightly improved, increased values from +0h to +6h, slightly decreased values from +6h to +12h • upper-air verification (11-day summer period): • LHN cools and dries PBL, increases mid-tropospheric stability and upper-tropospheric moisture • overall neutral impact on rmse of forecasts, temperature improved in PBL at +6h moderately degraded around 700 hPa later on 05.08.2005 - 26 -
Aspects of Further Work • more case studies for both summer and winter periods (up to 10 days), (further problems ?) • further diagnosis of LHN results, in order to better understand some problems (e.g. performance of 0-UTC runs, decrease of forecast impact, too strong LHN forcing) and improve / tune LHN scheme • role of gravity waves • vertical structure of precipitating cells (e.g. wind field) • vertical distribution of LHN increments • environment of precipitation cells (moisture convergence) • horizontal filtering • introduction of PI-data (international composite) outside the German DX-area • further use of cloud type product of Nowcasting-SAF within LHN (humidity adjustment) • LMK test suites (periods up to three months), with comprehensive verification • ( possibly: use of 3D reflectivity data in order to determine more precisely (both in space and time) the areas of positive latent heat release • height-dependent scaling of the latent heat rate ) 05.08.2005 - 27 -
spec. cloud water spec. cloud ice latent heat rate spec. rain content spec. snow content Prognostic Precipitation and LHN - Influence on LHN 05.08.2005 - 29 -
Possible adaptations: • Adjusting the controlling LHN parameters • Applying of the temperature increment only in certain layers • Adaptation of the grid point search routine • Spatial Averaging of precipitaion patterns and the pattern of latent heat release • Spatial displacement of radar image • Use of an undelayed precipitation rate as reference for the LHN • diagnostically calculated precipitation rate • vertical integration of the precipitation fluxes 05.08.2005 - 30 -