Download
1 / 72
720 likes | 851 Views
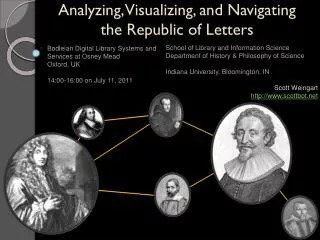
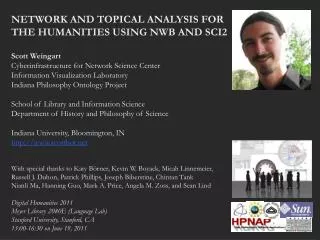
ANALYZING AND VISUALIZING CORRESPONDENCE NETWORKS FOR BROWSABLE INTERFACES Scott Weingart Cyberinfrastructure for Network Science Center Information Visualization Laboratory Indiana Philosophy Ontology Project School of Library and Information Science

E N D
ANALYZING AND VISUALIZING CORRESPONDENCE NETWORKS FOR BROWSABLE INTERFACES Scott Weingart Cyberinfrastructure for Network Science Center Information Visualization Laboratory Indiana Philosophy Ontology Project School of Library and Information Science Department of History and Philosophy of Science Indiana University, Bloomington, IN http://www.scottbot.net Thanks to Katy Borner, The Sci2 Team, and Huygens ING. Representing The Republic of Letters, 6/30/2011-7/1/2011 Huygens ING – Institute for Dutch History The Hague, The Netherlands 10:50-12:20 on July 1, 2011
10:55-11:05 The Importance and Dangers of Visualization – Use & Theory 11:05-11:20 The Epistolarium – Networks, Topics & Tools 11:20-11:25 Computational Modeling 11:25-11:35 Move to other room 11:35-11:50 Sci2 Tool Basics 11:50-12:10 Sci2 Workflow Design: Padgett's Florentine Families - Prepare, load, analyze, and visualize family and business networks from 15th century Florence. 12:10-12:20 Q&A and Technical Assistance Workshop Overview 2
10:55-11:05 The Importance and Dangers of Visualization – Use & Theory 11:05-11:20 The Epistolarium – Networks, Topics & Tools 11:20-11:25 Computational Modeling 11:25-11:35 Move to other room 11:35-11:50 Sci2 Tool Basics 11:50-12:10 Sci2 Workflow Design: Padgett's Florentine Families - Prepare, load, analyze, and visualize family and business networks from 15th century Florence. 12:10-12:20 Q&A and Technical Assistance Workshop Overview 3
The Importance and Dangers of Visualization: Use & Theory 4
Solidifies objects of inquiry Exploration Discovery Trend-spotting Evidence Audience Engagement Engaging public / funding agencies Uses of Visualization
[Visualization] aim at more than making the invisible visible. [It aspires] to all-at-once-ness, the condensation of laborious, step-by-step procedures in to an immediate coup d’oeil… What was a painstaking process of calculation and correlation—for example, in the construction of a table of variables—becomes a flash of intuition. And all-at-once intuition is traditionally the way that angels know, in contrast to the plodding demonstrations of humans. Descartes’s craving for angelic all-at-once-ness emerged forcefully in his mathematics…, compressing the steps of mathematical proof into a single bright flare of insight: “I see the whole thing at once, by intuition.” Lorraine Daston – On Scientific Observation The Importance of Visualization
[H]umanists have adopted many applications such as GIS mapping, graphs, and charts for statistical display that were developed in other disciplines… such graphical tools are a kind of intellectual Trojan horse… Data pass themselves off as mere descriptions of a priori conditions. Rendering observation (the act of creating a statistical, empirical, or subjective account or image) as if it were the same as the phenomena observed collapses the critical distance between the phenomenal world and its interpretation, undoing the basis of interpretation on which humanistic knowledge production is based... we seem ready and eager to suspend critical judgment in a rush to visualization. Johanna Drucker – Humanities Approaches to Graphical Display Warnings
Data format limits use, already an act of interpretation. Statistics is often misused (wield it very carefully). Interpreting spatial distance as meaningful. Always include a legend (this presentation breaks that rule). Accidental legitimization in eyes of public. Warnings
Character Networks in the 19th Century British Novel -Graham Sack I use computational methods to count the frequency and co-occurrence of a generally ignored sub-class of common words, namely, character names. Character names are often regarded as noise and excluded from authorship and stylistics analysis because they are not consistent across texts. This study makes character names its main object of analysis because the objective is quite different: rather than style or authorship, this study attempts to make inferences about characterization and social form, two areas about which computational analysis has had comparatively little to say.
Character Networks in the 19th Century British Novel -Graham Sack
Character Networks in the 19th Century British Novel -Graham Sack
Word Co-Occurrences in European Fairytales -Jorgensen & Weingart
10:55-11:05 The Importance and Dangers of Visualization – Use & Theory 11:05-11:20 The Epistolarium – Networks, Topics & Tools 11:20-11:25 Computational Modeling 11:25-11:35 Move to other room 11:35-11:50 Sci2 Tool Basics 11:50-12:10 Sci2 Workflow Design: Padgett's Florentine Families - Prepare, load, analyze, and visualize family and business networks from 15th century Florence. 12:10-12:20 Q&A and Technical Assistance Workshop Overview 13
Networks Correspondence, Citation, and Co-Citation Networks show no less nor more information than is already available to the researcher, and is subject to the same biases. These networks show that same information in a new light, and allows us to ask new sorts of questions, rethink our objects of inquiry, and systematize our methods of large scale analysis and comparison.
The Epistolarium Simon Episcopius in CEN network
The Epistolarium Grotius corpus French letters
The Epistolarium Chr. Huygens corpus Latin letters
The Epistolarium Chr. Huygens corpus Latin letters
10:55-11:05 The Importance and Dangers of Visualization – Use & Theory 11:05-11:20 The Epistolarium – Networks, Topics & Tools 11:20-11:25 Computational Modeling 11:25-11:35 Move to other room 11:35-11:50 Sci2 Tool Basics 11:50-12:10 Sci2 Workflow Design: Padgett's Florentine Families - Prepare, load, analyze, and visualize family and business networks from 15th century Florence. 12:10-12:20 Q&A and Technical Assistance Workshop Overview 26
Quality = .8 Idea 1 Quality = .24 Idea 2 Scholar 1 Scholar 2 Scholar 3 Strength: 4 Strength: 1 Strength: 1 Strength: 3 Age: 12, Lifespan: 50 Quality of new ideas: .4 +/- .05 Age: 40, Lifespan: 85 Quality of new ideas: .2 +/- .15 Age: 18, Lifespan: 80 Quality of new ideas: .9 +/- .03
Modeling the Republic of Letters or Mmmmm Spaghetti Dinner with Meatballs
10:55-11:05 The Importance and Dangers of Visualization – Use & Theory 11:05-11:20 The Epistolarium – Networks, Topics & Tools 11:20-11:25 Computational Modeling 11:25-11:35 Move to other room 11:35-11:50 Sci2 Tool Basics 11:50-12:10 Sci2 Workflow Design: Padgett's Florentine Families - Prepare, load, analyze, and visualize family and business networks from 15th century Florence. 12:10-12:20 Q&A and Technical Assistance Workshop Overview 31
Just as the microscope empowered our naked eyes to see cells, microbes, and viruses thereby advancing the progress of biology and medicine or the telescope opened our minds to the immensity of the cosmos and has prepared mankind for the conquest of space, macroscopes promise to help us cope with another infinite: the infinitely complex. Macroscopes give us a ‘vision of the whole’ and help us ‘synthesize’. They let us detect patterns, trends, outliers, and access details in the landscape of science. Instead of making things larger or smaller, macroscopes let us observe what is at once too great, too slow, or too complex for our eyes. Microscopes, Telescopes, and Macrocopes
Custom Tools for Different Scientific Communities Information Visualization Cyberinfrastructure http://iv.slis.indiana.edu Network Workbench Tool + Community Wiki http://nwb.slis.indiana.edu Science of Science (Sci2) Tool and Portal http://sci.slis.indiana.edu Epidemics Cyberinfrastructure http://epic.slis.indiana.edu/ 180+ Algorithm Plugins and Branded GUIs + Core Architecture Open Services Gateway Initiative (OSGi) Framework. http://orgi.org Cyberinfrastructure Shell (CIShell) http://cishell.org Macroscope Design 34
NWB Tool Interface Components Console shows references to seminal works. Workflows are recorded into a log file, and soon can be re-run for easy replication. All algorithms are documented online; workflows are given in tutorials.
File, Preprocessing, Modeling, and Visualization Menus Börner, Katy, Sanyal, Soma and Vespignani, Alessandro (2007). Network Science. In Blaise Cronin (Ed.), ARIST, Information Today, Inc./American Society for Information Science and Technology, Medford, NJ, Volume 41, Chapter 12, pp. 537-607. http://ivl.slis.indiana.edu/km/pub/2007-borner-arist.pdf 36
Analysis Menu and Submenus Börner, Katy, Sanyal, Soma and Vespignani, Alessandro (2007). Network Science. In Blaise Cronin (Ed.), ARIST, Information Today, Inc./American Society for Information Science and Technology, Medford, NJ, Volume 41, Chapter 12, pp. 537-607. http://ivl.slis.indiana.edu/km/pub/2007-borner-arist.pdf 37
Supported Data Formats The NWB tool supports loading the following input file formats: • GraphML (*.xml or *.graphml) • XGMML (*.xml) • Pajek .NET (*.net) & Pajek .Matrix (*.mat) • NWB (*.nwb) • TreeML (*.xml) • Edge list (*.edge) • CSV (*.csv) • ISI (*.isi) • Scopus (*.scopus) • NSF (*.nsf) • Bibtex (*.bib) • Endnote (*.enw) and the following network file output formats: • GraphML (*.xml or *.graphml) • Pajek .MAT (*.mat) • Pajek .NET (*.net) • NWB (*.nwb) • XGMML (*.xml) • CSV (*.csv) Formats are documented at https://nwb.slis.indiana.edu/community/?n=DataFormats.HomePage. 38
Excel Database Text CSV File-types
Matrix Adjacency List Node & Edge List Network Formats
NWB Format *Nodes id*int label*string totaldegree*int 16 “Merwede van Clootwyck, Matthys van der (1613-1664)” 1 36 “Perrault, Charles” 1 48 “Bonius, Johannes” 1 67 “Surenhusius Gzn., Gulielmus” 1 99 “Anguissola, Giacomo” 1 126 “Johann Moritz, von Nassau-Siegen (1604-1679)” 6 131 “Steenberge, J.B.” 1 133 “Vosberghen Jr., Caspar van” 1 151 “Bogerman, Johannes (1576-1637)” 25 *DirectedEdges source*int target*int weight*float eyear*int syear*int 16 36 1 1640 1650 16 126 5 1641 1649 36 48 2 1630 1633 48 16 4 1637 1644 48 67 10 1645 1648 48 36 2 1632 1638 67 133 7 1644 1648 67 131 3 1642 1643 99 67 9 1640 1645 126 16 3 1641 1646 131 133 5 1630 1638 131 99 1 1637 1639 133 36 4 1645 1648 133 48 8 1632 1636 151 48 6 1644 1647
Science of Science (Sci2) Toolhttp://sci.slis.indiana.edu • Explicitly designed for SoS research and practice, well documented, easy to use. • Empowers many to run common studies while making it easy for exports to perform novel research. • Advanced algorithms, effective visualizations, and many (standard) workflows. • Supports micro-level documentation and replication of studies. • Is open source—anybody can review and extend the code, or use it for commercial purposes.
OSGi/CIShell powered tool with NWB plugins and many new scientometrics and visualizations plugins. Börner, Katy, Huang, Weixia (Bonnie), Linnemeier, Micah, Duhon, Russell Jackson, Phillips, Patrick, Ma, Nianli, Zoss, Angela, Guo, Hanning & Price, Mark. (2009). Rete-Netzwerk-Red: Analyzing and Visualizing Scholarly Networks Using the Scholarly Database and the Network Workbench Tool. Proceedings of ISSI 2009: 12th International Conference on Scientometrics and Informetrics, Rio de Janeiro, Brazil, July 14-17 . Vol. 2, pp. 619-630. Sci2 Tool – “Open Code for S&T Assessment” GUESS Network Vis Sci Maps Horizontal Time Graphs
Sci2 Tool Geo Maps Circular Hierarchy
Studying Four Major NetSci Researchers (ISI Data) Thomson Reuter’s Web of Knowledge (WoS) is a leading citation database cataloging over 10,000 journals and over 120,000 conferences. Access it via the “Web of Science” tab at http://www.isiknowledge.com (note: access to this database requires a paid subscription). Along with Scopus, WoS provides some of the most comprehensive datasets for scientometric analysis. To find all publications by an author, search for the last name and the first initial followed by an asterisk in the author field. 46
Download all papers by Eugene Garfield Stanley Wasserman Alessandro Vespignani Albert-László Barabási from Science Citation Index Expanded (SCI-EXPANDED) --1955-present Social Sciences Citation Index (SSCI)--1956-present Arts & Humanities Citation Index (A&HCI)--1975-present Data Acquisition from Web of Science 47
Age Total # Cites Total # Papers H-Index Eugene Garfield 82 1,525 672 31 Stanley Wasserman 122 35 17 Alessandro Vespignani 42 451 101 33 Albert-László Barabási 40 2,218 126 47 (Dec 2007) 41 16,920 159 52 (Dec 2008) Comparison of CountsNo books and other non-WoS publications are covered. 48
Load*yoursci2directory*/sampledata/scientometrics/isi/FourNetSciResearchers.isi’ using 'File > Load‘ and parameters And file with 361 records appears in Data Manager. Extract Co-Author Network 49
To extract the co-author network, select the ‘361 Unique ISI Records’ table and run ‘Data Preparation > Extract Co-Author Network’ using isi file format: The result is an undirected but weighted network of co-authors in the Data Manager. Run ‘Analysis > Network > Network Analysis Toolkit (NAT)’ to calculate basic properties: the network has 247 nodes and 891 edges. Use ‘Analysis > Network > Unweighted and Undirected > Node Degree’ to calculate the number of neighbors for each node. To view the complete network, select the ‘Extracted Co-Authorship Network’ and run ‘Visualization > Networks > GUESS’. Network is loaded with random layout. In GUESS, run ‘Layout > GEM’ and ‘Layout > Bin Pack’ to improve layout. Extract Co-Author Network(see section 5.1.4.2 on correcting duplicate/misspelled author names) 50