Download
1 / 60
600 likes | 705 Views
NBS-M009 – 2010 LOW CARBON BUSINESS REGULATION AND ENTREPRENEURSHIP. Transmission issues for the Future Mechanisms to Promote Renewable Energy Non Fossil Fuel Obligation Renewable Obligation Marine Supply Obligation (Scotland) Feed in Tariffs Renewable Transport Fuel Obligation

E N D
NBS-M009 – 2010 LOW CARBON BUSINESS REGULATION AND ENTREPRENEURSHIP • Transmission issues for the Future • Mechanisms to Promote Renewable Energy • Non Fossil Fuel Obligation • Renewable Obligation • Marine Supply Obligation (Scotland) • Feed in Tariffs • Renewable Transport Fuel Obligation • Renewable Heat Incentive? • An Integrated Obligation?
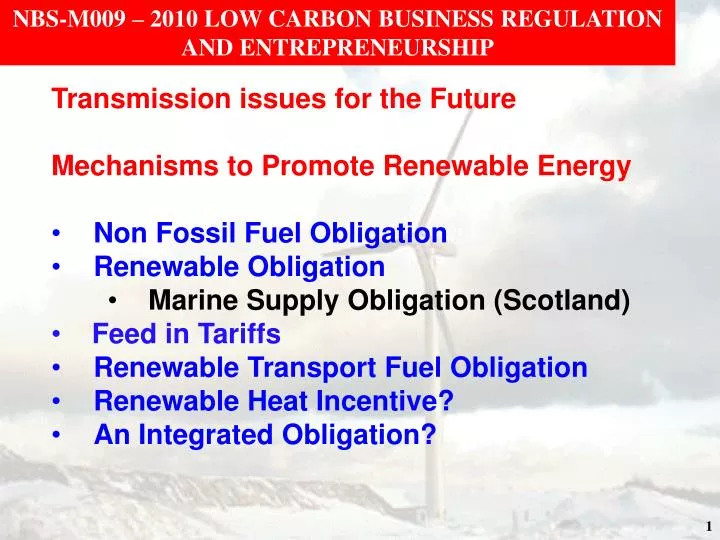
2006 - 2007 2012 - 2013 40271759 27501565 2268 1165 SHETL SHETL SPT SPT Upper North Upper North 2513 3912 578711092 600511191 5708 4380 6205 4561 1320 7834 7264 6100 6612 North Netherlands North 11709 9223 Midlands Midlands 11274 11258 7804 9374 8480 8992 Central Central 6818 5305 5186 5900 32416751 27926704 Estuary 29271153 31971999 Estuary 1774 1188 1988 1988 South West South West 14332 25720 16537 28267 France France 2
Transmission Network in the UK 400 kV 275 kV 132 kV Scotland Historically transmission networks have been different in England and Wales compared to Scotland Beauly Denny Line is a constraint – upgrade has raised over 18000 objections England and Wales Англия и Уэльс Transmission throughout England, Wales and Scotland became unified on April 1st 2005 3
Generator Connection Charges under BETTAПлата за подключение к генератору энергоснабжения по BETTA 1 2 3 4 6 A > £20 per kW 7 5 B 10 £15 to £20 per kW 8 C £10 to £15 per kW 9 11 D £5 to £10 per kW 13 12 E £0 to £5 per kW 14 15 F - £5 to £0 per kW 18 17 G 20 19 - £10 to -£5 per kW 16 Charges from 1st April 2010
Transmission Network Use of System (TNUoS) Demand Charges (2010 – 2011) England & Wales Northern North West Yorkshire Англия и Уэльс East Midlands N Wales & Mersey Midlands Eastern South Wales London South East Southern South Western Scotland Шотландия Northern Scotland Southern Scotland
Constraints on Grid Connections – Opportunities for new conenctions Beauly – Denny Line Opportunities for Grid Connection in different regions of UK. Much of Renewable resource is in Scotland where constraints are high. Critical is lack of capacity on Beauly – Denny Line which needsu rgent upgrading but is facing protracted delays – over 17000 objections lodged.
REGULATED POWER ZONES • Transmission and Distribution Networks are critical to electricity security. • Losses on line: = I 2 R where I is the current and R is resistance • power transmitted P = V * I - V = voltage • Typical UK domestic voltage - 240V • European Voltage - 220V • North American Voltage 110V • These are nominal voltages and system must control voltages within a narrow band of this. Losses are reduced by increasing voltage
REGULATED POWER ZONES • The consequence of resistive losses is that the transmission and distribution cables heat up and may typically be running at 50o C+ • As they heat up they expand and the cables will sag more at mid-span with a the possibility of a flashover. • This means that there will be less sag when the cable temperature is lower – i.e. in winter and also in times of higher wind speeds when the cooling effect of the wind will be greatest. There is thus a maximum power load that any cable can take and this limits the number of connections that can be made. A further problem with AC transmission is that current flows mostly through the skin with much of the cross section not used effectively. Unlike DC
REGULATED POWER ZONES Traditional way to allocate generation connections: • Order of application according to potential maximum connection capacity up to total capacity of transmission/distribution line. • A safe approach which ensures that transmission/ distribution lines are not overloaded. BUT • May not make optimum use of transmission capacity. Example: • Suppose a line has 2000 MW capacity - a typical twin circuit 400 kV line. • Order of connection allocations: • Generator 1: 1000 MW – say with 2 x 500 MW sets • Generator 2: 500 MW • Generator 3: 500 MW – with 2 x 250 MW sets.
REGULATED POWER ZONES • If all sets are generating – 2000MW i.e. capacity of line and no more sets can connect without the expense of transmission line upgrade. • If generating sets are fossil fuel, then they may have a relatively high load factor and traditionally that has not been a problem. • BUT if say one of Generator 1’s sets is not generating, only 1500 MW of the 2000 MW of the line capacity is used. • BUT no new generators can connect as the inactive set may come back on line. Grandfathering Rights
REGULATED POWER ZONES Problem is exacerbated with generating plant of low load factor e.g. wind and was first identified in Orkney where significant renewable generation threatened to seriously overload distribution system. Orkney is connected to mainland by 1 x 30 MW and 1 x 20 MW cable. A fossil fired power station on Flotta associated with the oil terminal must run for safety reasons typically around 4.5 MW. Burgar Hill had historic rights of around 7 MW with the European Marine Energy Centre a further 7MW also in this category. Thereafter there were several other wind developments which threatened to exceed total capacity of cables to mainland as it was assumed that one of the two cables might be out of action giving only a maximum potential connection capacity of 20 MW.
REGULATED POWER ZONES Total Historic Generating Capacity ~ 18.5 MW Minimum Demand in Orkney ~ 7 MW Capacity of smaller cable to mainland ~ 20 MW Maximum Generation on Orkney which would not overload single mainland cable is 27 MW – i.e 8.5 MW new capacity could be connected. But EMEC capacity is often 0 MW, and rarely is Burgar Hill at its rated output. If dynamic dispatch of generation capacity is used much more generation could be connected.
REGULATED POWER ZONES Evaluate total system capability at any one time C = mainland connection capacity (i.e. 20 or 30 or 50 MW) + instantaneous demand on Orkney Subtract from C those generating connection which have grandfathering rights, but only up to the amount of instantaneous generation (NOT maximum connection rights) This gives maximum additional capacity which can be connected at that time. If this also is done on a first application first served basis, it would be possible to connect much more renewable generation than otherwise possible. However, it may mean that wind turbines at the end of the queue may not be able to generate when wind speed is optimum and returns on investment are best
REGULATED POWER ZONES Suppose C = 60 MW – i.e. both cables operating and demand is 10 MW If Flotta output is 7 MW and EMEC is 7MW and Burgar Hill say 3.5 MW (i.e less than rated connection of 7MW as wind speed is low – i.e. instantaneous load factor is 50%) Available additional connection is 60 – 17.5 i.e 42.5 MW If this were taken by additional Wind at 50% load factor then 85 MW of additional capacity could connect. BUT if wind speed increased to rated speed of wind turbines, Burgar Hill would now be at 7 MW and available capacity would be 39 MW. If all of this were as wind turbines at rated output (i.e. 100% load factor) only 39 MW could actually generate and 46 MW would have to shut down at the time they were most productive.
REGULATED POWER ZONES Consequence of Dynamic Regulation of Power Zone • More effective use of transmission/distribution cables is made • A greater proportion of renewable energy can be brought on line at an earlier stage BUT • Those connecting last may find return on investment poor. Lincolnshire RPZ operates only to transmit power from offshore wind farm • Does not primarily address demand, but cooling effect on cables to minimise sag • In winter – higher wind speeds – greater output capacity from wind turbines • BUT weather is cooler and cooling effect of wind on cables is greater so cables can transmit more
SMART GRIDS – DYNAMIC REGULATION of DEMAND ELECTRIC VEHICLES: Widespread deployment of electric vehicles could adversely affect the generation of electricity – leading to less effective use of generating capacity. Existing peak demand occurs around 17:00 the time when most people return home . Owners would potentially would start charging their vehicles potentially exacerbating the load profile Electric Vehicle demand from Dave Openshawhttp://www.eeegr.com/uploads/DOCS/778-20100726131949.pdf.
SMART GRIDS – DYNAMIC REGULATION of DEMAND Strategy 1: Unrestricted charging as per previous slide Strategy 2: Encourage people not to charge between 17:00 and 21:00 with a reduced tariff. Assume 75% take this up ~ would remove light green area. Strategy 3: Discharge remaining store in car batteries to help existing peak. i.e. move green area to red – at further reduced tariff – example shows 25% of people adopting this. Electric Vehicles with Smart Charging
SMART GRIDS – DYNAMIC REGULATION of DEMAND HEAT Pumps: Widespread deployment of Heat Pumps would exacerbate electricity demand Heat Pump demand from Dave Openshaw http://www.eeegr.com/uploads/DOCS/778-20100726131949.pdf.
SMART GRIDS – DYNAMIC REGULATION of DEMAND There is a less “peaky” demand from heat pumps than electric vehicles because of thermal store benefits from under floor heating, Use of an additional thermal store could help further to fill mid-day peak and lop peak morning and evening periods for charge overnight.
AC : DC transmission of electricity 1000 MW over 100 km 5 AC cables each with 3 cores required Equivalent DC AC Transmission current flows in skin – much of cable is not used DC Transmission current flows in whole of cross section 20
AC : DC transmission of electricity • DC transmission is purely resistive and decreases slowly with distance • AC transmission is inductive and resistive and power falls off rapidly even when compensation is provided 21
Shetland Orkney Lewis Dounreay Peterhead Torness DockingOffshore Killingholme Walpole East Claydon Sundon Grain 2020 Offshore DC Network Norway Offshore Marine Node Onshore Node Germany Netherlands 300 MW 700 MW 1000 MW 22
Costs of East Coast DC Network • Stage 1 Core Network: £1.6b • Stage 2 full Network: £4.8b • Average cost £750 per MW-km • Would be built in sectors: • Typical Segment costs: • Peterhead to Walpole: £381M (1000 MW cable – 608 km) • Peterhead to North Scotland Offshore Marine Hub £412M (2000 MW cable – 245 km) • For details see WEB Links West Coast DC Links from North Scotland to Mersey are also being examined
Mechanisms to Promote Renewable Energy LOW CARBON BUSINESS REGULATION AND ENTREPRENEURSHIP • Non Fossil Fuel Obligation • The Renewable Obligation • Marine Supply Obligation (Scotland) • Feed in Tariffs • The Renewable Transport Obligation • Renewable Heat Incentive • An Integrated Obligation? 24
Non Fossil Fuel Obligation: NFFO-1 • Introduced at time of Privatisation in 1990 • Initially seen as a subsidy for nuclear, but later termed NFFO with separate tranche for Renewables • NFFO became associated only with Renewables and was subdivided into technology bands • 5 Tranches: NFFO-1, NFFO-2, NFFO-3, NFFO-4, NFFO-5 • NFFO-1 (1990) required a minimum contribution of 102 MW from new "renewables" • Contracts made 152 MW but by November 2000 the residual capacity was 144.5 MW. • Fixed Price paid for electricity generated. • Wind had highest guaranteed price of 11p per kWh compared with typical consumer price at time of 6 – 7p and wholesale prices around 3p. This meant that there was a substantial subsidy for wind. • Potential generators had to submit applications for the subsidy, but not all ultimately received planning permission, or alternatively the schemes ultimately failed through lack of finance. • Subsidy was paid until 31st December 1998 – a limit initially placed by the EU 25
Non Fossil Fuel Obligation: NFFO-2 • As with NFFO-1 a fixed price was paid to all generating capacity • NFFO-2 (1991) was further divided the capacity by technology type and the outcome was as indicated in the table below. • The payments under NFFO-2 also expired on 31st December 1998 Note: Because payments started 1 year later, there was effectively 12.5% less subsidy than for NFFO-1 26
NFFO – 3 – January 1995 • As with previous tranches many of the schemes failed through planning permission etc. • Clearance was given from EU for NFFO-3 to extend beyond 1998, and covers period up to 30th November 2014 • Unlike NFFO -1 and NFFO-2, the price paid for renewables was not a fixed price. Each potential supplier had to bid to supply electricity. • Within any one technology band, there were a number of different bids. • Total tranche was 627.8 MW divided between technology bands- successful ones were those which required the least subsidy to provide this amount of installed capacity. • NFFO –Orders 4 and 5 • NFFO orders 4 and 5 were announced in mid 1990s and came into effect in 1996 and 1998 respectively. • Very similar to NFFO-3 and both have a twenty year timescale finishing in 2016 and 2018 respectively. • The bid prices were noticeably lower than for NFFO-3.
Actual Contracts for different NFFO Tranches NFFO Tranche 28
NFFO Status as at end of December 2006 • Overall actual position as opposed to contracted • Many NFFO projects did not get off ground because contracts to supply were made before planning and grid issues had been addressed. • Situation with wind even more dramatic. Wind Generation 29
Renewables Obligation • 1999/2000 UK Government considered different mechanisms to promote renewables following end of NFFO. • NFFO 1 and NFFO 2 were a form of feed in tariff now used by Germany • NFFO 3, 4, and 5 were a derivative of this - generators bid to supply and cheapest were given a guaranteed price for whole of life of project up to 20 years. • Other mechanisms considered • Climatic Change Levy (CCL) goes a small way to encouraging renewables, but only applies to businesses and is at a fixed rate of 0.43p per kWh. • Charge was neutral to businesses overall as there was a rebate for the Employers National Insurance Contribution. Energy Efficient business with large staff numbers benefitted. • Direct Grants for Renewable Energy Projects • Energy Taxes/Emissions Trading • Renewable Obligation – targets set for each year and a mechanism of payments for failure to comply.
On whom should Obligation Fall Generators System Operator (National Grid) Distributed Network Operator Supplier Consumer For various reasons the obligation fell on Suppliers For an enhanced move towards low carbon an obligation on large businesses may be more effective but retaining obligation on suppliers for small businesses and domestic market. >> An integrated renewable obligation ????????? Decision taken that only Suppliers should be Obligated Renewables Obligation
Requires all suppliers to provide a minimum percentage of electricity from Eligible (New) Renewables. Each 1 MWh generated by renewable qualifies for a Renewable Obligation Certificate (ROC) Obligation increases each year – currently it is 10.4% of electricity supplied to consumers. Accounting Period is 1st April – 31st March Compliance can be achieved by: Either Generating sufficient renewable energy to get required number of ROCs Purchase ROCs from another generator Pay a Buy – Out Fine Buy-Out set initially at £30 / MWh but indexed linked each year. This is decided by OFGEM usually in January preceding accounting period and is currently (2010-11) set at £36.99 Renewables Obligation
Renewables Obligation The percentage obligation was initially set as far as 2010 – 2011, but later extended to 2015 – 2016. The scheme has now been extended to 2037, but with a Buy Out Price is increased annually by OFGEM and is approximately equal to RPI. Total market has a value of around £300M+ 33
Renewables Obligation Proportion generated by each technology 2009 - 2010 Proportion generated by different technologies. Some were very small amounts – see table Link to ROC_Register
Renewables Obligation 2009 - 2010 Load Factors 2009 - 2010
Renewable Obligation Certificates Notifies OFGEM of compliance -i.e. ROCs or pays FINE Notifies Regulator how much generated. ROC’s issued FINES recycled to holders of ROCs in proportion to number of ROCs held. Sells Electricity with or without ROCs Supplier Buys ROCs from Trader Sells ROCs to Trader The Regulator OFGEM Renewable Generator SUPPLIERS Trader and Brokers Because of recycling, ROCs have value greater than their nominal face value
£15 - 18 per MWh Recycled fines - Potential Value of Renewable Generation • ~£1.50 per MWh Embedded benefits - less losses • £4.85 per MWh Climatic Change Levy Exemption • £36.99 per MWh Face value of ROC (2010 – 2011) • £39.96 per MWh Wholesale Electricity Price • (average daily price 01/08/2010 – 24/08/2010) Value of Renewable Generation ~£95- £100 per MWh Less BETTA Imbalance charges ~ £2 - £5 per MWh Current Net Value of Renewable Generation ~£95 per MWh 37
The Value of the ROC Market Note: 1) Values in last two columns are updated values from handout 2) Data for 2009 – 10 will be available in March 2011 3) The Figures in the “Value of ROC Market” are slightly lower than predicted for data because of non-payment by companies who ceased trading. This figure amounts to around £5M a year.
An Example what is likely value by March 2010 Buy out price for 2009 – 2010 £37.19 per MWh Estimated demand is 360 TWh Obligation is 10.4% Requirement from renewables is 360*0.104 TWH = 37440000 MWh At April 1st 2008 there were6250 MWinstalled having an average load factor over all technologies of 30%. In 2009 – 2010 will generate 6250*8760*0.3 = 16425000MWh Assume 1500 MWinstalled in 2008 – 2009 At same load factor will generate 3942000 MWh in 2009 – 2010 Assume2500 MWinstalled mid way through 2009 - 2010 At same load factor will generate 3285000 MWh in 2009 – 2010 Total generated by renewables = 23652000 MWh A shortfall of13788000 MWhon which Buy Out would be payable ROC Market: How total value of ROCs is estimated NOTE: Simplified Version – assuming all technologies have same load factor
shortfall of 13788000 MWh on which Buy Out would be payable Buy Out Price: £37.19 Total value of Buy Out Fund = £512781235 ROCs presented = 23652000 MWh Recycled value =£21.68 per ROC Total value of ROC = £58.87 If 5000 MW were commissioned instead of 2500 in 2009 – 2010 Total Buy Out Fund would be£390610771 Recycled Value per ROC would be £14.50 Total Value of ROC = £51.69 Note: with banding analysis is a little more complicated. What happens if generation exceeds compliance level? ROC Market: How total value of ROCs is estimated
ROC Market – the Cliff Edge Problem 12993 MW Buy Out Price Target could be exceeded in particularly favourable weather conditions. Buy Out Fund would have no money in it and ROCs would become worthless leading to instability in price.
Headroom Principle: Set target annually with a a percentage above expected generation level – would reduced likelihood, but Banding would increase likelihood of Cliff Edge being reached. Solution: The Ski-slope principle If over compliance occurs, All holders of ROCs pay Buy out Prices into Pool Pool money is then recycled in proportion to ROCs originally held. In example and without Ski-Slope, value of ROCs would fall to 0 if more than 12993MW were commissioned in 2009 – 2010. With Ski-Slope mechanism, 15000 MW would cause ROC to only fall in value from £37.19 to £34.74 At 20000MW, price would be £29.85 ROC Market – the Cliff Edge Problem
Banding System wasintroduced from 1st April 2009. Reference projects such as on-shore wind will continue to get 1 ROC per MWh, Technologies such as offshore wind get 1.5 ROCs per MWh, Solar PV, advanced gasification Biomass get 2.0 ROCs per MWh, Co-firing generates 0.5 ROCs per MWh With no banding: incentive only to exploit established technologies Banding will enhance returns for developing technologies. If targets are kept the same, it is easier to achieve targets and “Cliff Edge” Problem could become acute. Targets for a given % of renewables in terms of MWh will not be met under current legislation if there is an upward drift in banding. Only if reduced ROCs from co-firing balance enhanced ROCs from newer technologies will system remain stable. Developments in the Renewables Obligation
Scottish Renewable Obligation Scottish Renewable Obligations are largely similar but there are some differences > SROCs but introduced concept of a Marine Supply Obligation covering Tidal and Wave. The MSO was to set an obligation (up to the output from 75MW) on suppliers as a part of the Renewable Obligation. Problem How do you set a target at a time when no devices are yet operational - everyone would have to pay buy – out Solution: Use the capacity of devices due to come on line in year and use this as basis of obligation. Need to incorporate Headroom Principle to avoid “Cliff Edge” problem NOTE: the HEADROOM Principle is now planned for use with ROCs Scottish Parliament introduced the concept of Marine Supply Obligations in 2006 for offshore energy supply, but looks as though this may be phased out under current consultation. Scotland is considering proposing an even more enhanced banding system– up to 3 ROCs per MWh for tidal stream and 5.0 ROCs for wave generation. For links to Scottish approach – see WEBSITE
Marine Supply Obligation: Example of Headroom • Assume Marine devices have a load factor or 33% and use a 30% headroom of the projected output • Assume that in 2008, 5 MW are initially assumed to be commissioned, but only 2.5MW are in reality. • On basis of 5MW @ 33% load factor, 14454 MWh would be generated and the headroom would be set at 30% of this i.e. 4336 MWh. • The actual amount generated from 2.5 MW would be 7227 MWh and the headroom would in fact be 60% in this first year. • i.e. the total on which buyout would be paid would be 4336 MWh
Marine Supply Obligation: Example of Headroom • In subsequent years a similar procedure is adopted • initial obligation is determined from the actual installed capacity at the end of previous year plus the expected new capacity to come on stream. [NOT THE ACTUAL END OF YEAR CAPACITY] • i.e. in year 2 • projected capacity = 2.5 (existing) + 10 (projected) = 12.5 MW • So calculated headroom for year 2 @ 33% load factor and 30% headroom = 12.5 *0.33*8760 *0.3 = 10841 MWh
Feed in Tariffs – Introduced 1st April 2010 ***** for first 20000 installations
Feed in Tariffs – Export and Issue of Deeming Payment for tariffs will be from a levy on Utility Companies which MAY see a cumulative rise in bills of around £1 billion or more. In addition there will be a payment of 3p per kWh for any electricity exported as opposed to consumed on premises. BUT an export meter is needed to identify this. Householder will save on imported electricity at ~ 11 – 12p per kWh, so optimum financial model may not be to generate as much as possible i.e. for each unit generated and consumed it is worth 41.3+ 11 = 52.3p /kWh for each unit exported it is worth 41.3 + 3 = 44.3 p/kWh If no export meter is fitted – a transition arrangement of deeming that 50% of generation will be exported will be made - that may well not be as attractive to consumer. http://www.decc.gov.uk/en/content/cms/what_we_do/uk_supply/energy_mix/renewable/feedin_tariff/feedin_tariff.aspx
From the National Infra-Structure Plan 2010 following Comprehensive Spending Review • The Government will reform the electricity market, so that it attracts the private sector investment necessary to meet the UK’s energy security and climate change objectives, including the investment in nuclear, carbon capture and storage and renewable technology. • In addition to supporting the carbon price, this will also assess the role that revenue support mechanisms (such as Feed-In Tariffs), capacity mechanisms and emission performance standards could play. • For complete information see Section 4 of http://www.hm-treasury.gov.uk/d/nationalinfrastructureplan251010.pdf
From the National Infra-Structure Plan 2010 following Comprehensive Spending Review The Government will assess proposals against the criteria of cost-effectiveness, affordability and security of supply; • to ensure that regulation of national electricity networks enables the investment needed in transmission infrastructure to connect new low-carbon generation, such as nuclear power stations and offshore and onshore wind turbines; • maintain the Feed-In-Tariffs to support investment in emerging small-scale generation technologies in electricity, saving £40M by improving their efficiency, and complement this with the Renewable Heat Incentive to reward ground-source heat pumps and other renewable heat sources, while making efficiency savings of 20% by 2014-15 compared with the previous government’s plans. For complete information see Section 4 of http://www.hm-treasury.gov.uk/d/nationalinfrastructureplan251010.pdf