Download

1 / 26
260 likes | 449 Views
Teacher Evaluations and Support for Effective Instruction. Florida Department of Education What’s Working Series Tampa, Florida October 6, 2010. National nonprofit, founded by teachers in 1997 Partners with school districts, state education agencies, and charter schools

E N D
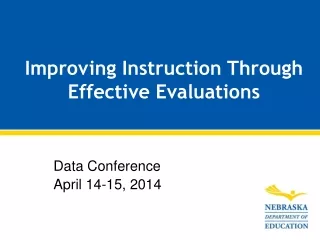
Teacher Evaluations and Support for Effective Instruction Florida Department of Education What’s Working Series Tampa, Florida October 6, 2010
National nonprofit, founded by teachers in 1997 Partners with school districts, state education agencies, and charter schools Targets acute teacher quality challenges Delivers a range of customized services and solutions on a fee-for-service basis Approx. 250 employees, most embedded in school district offices; majority are former teachers Past and present clients include: Districts: Baltimore, Chicago, Denver, Memphis, New Orleans, New York, Oakland, Philadelphia, San Antonio, Washington, DC States: Alaska, Louisiana, Texas, Virginia The New Teacher Project (TNTP) helps school districts and states fulfill the promise of public education by ensuring that all students—especially those from high-need communities—get excellent teachers.
A significant achievement gap separates white and minority students. By high school, minority students are four years behind white students. NAEP Grade 4 Reading NAEP Reading At age 17, African American and Latino students read at the same levels as 13 year-old white students. Percent of Students Average Scale Score Notes: *Accommodations for students with disabilities and English language learners not permitted; Trends similar for Math. Source: Original analysis of the Education Trust based on Long-Term Trends NAEP ; National Center for Education Statistics, NAEP Data Explorer, http://nces.ed.gov/nationsreportcard/nde, NAEP 2004 Trends in Academic Progress
Research has shown that effective teachers are the solution. Dallas students who start 2nd grade at about the same level of math achievement… …finish 5th grade math at dramatically different levels depending on the quality of their teachers. After 3 EFFECTIVE Teachers 50 After 3 INEFFECTIVE Teachers Original analysis by the Education Trust. Source: Heather Jordan, Robert Mendro, and Dash Weerasinghe, The Effects of Teachers on Longitudinal Student Achievement, 1997.
Certification Has a One-Point Impact on Achievement Source: Gordon, Kane, Staiger, Identifying Effective Teachers Using Performance on the Job, The Hamilton Project, Brookings Institution, April 2006.
In many districts, human capital plans are poorly aligned. An effective teacher in every classroom $ Policies and practices that lead to inaccurate evaluations, making it difficult to reward high performers and understand the developmental needs of low performers. Little rigor in tenure decisions. Not targeted to high-need schools or subjects. Bureaucratic dysfunction deters applicants. Low-rigor interviews. Archaic slotting procedures impede creation of effective teams. Dollars concentrated at senior end of career, regardless of actual teacher effectiveness. Compensation Recruitment Evaluation Hiring Screening Retention Development School Leadership Highest performing teachers often leave the classroom the soonest. Teachers are dismissed only because of the most flagrant actions. PD is not linked to individual evaluations. It is driven by what providers offer, and its effectiveness is rarely assessed. Minimum requirements; little consideration for quality. Principals lack authority, accountability, tools, incentives, and capability needed to manage the performance of their teachers.
To realize sustainable improvement, effective teaching must be the guiding concern behind all elements of a district’s human capital system. An effective teacher in every classroom Working Conditions Recruitment School- Level Human Cap. Mgmnt. Selection Effectiveness Management Optimize effectiveness of teacher workforce. CORE METRICS Talent Pipeline Create supply of effective teachers to fill all vacancies. CORE METRIC Number and percentage of new teachers who demonstrate effectiveness above a target threshold Retention / Dismissal Training / Certification Compensation Hiring / Placement Evaluation / Prof. Dev. On- Boarding Measures of student learning
Dramatic improvements in student achievement cannot occur without a sustained and strategic focus on maximizing teacher effectiveness. 5 Boost effectiveness of all teachers through effective evaluation and targeted professional development. Goals for Optimizing Teacher Effectiveness 2 Optimize new teacher supply by hiring from preparation programs whose teachers consistently achieve better student outcomes. 1 Retain and leverage most effective teachers. 3 Teacher Effectiveness in Improving Student Achievement 5 4 Improve or exit persistently less effective teachers and replace with more effective teachers. Prioritize effective teachers for high-need students. Current teacher performance Potential teacher performance
The Widget Effect “When it comes to measuring instructional performance, current policies and systems overlook significant differences between teachers. There is little or no differentiation of excellent teaching from good, good from fair, or fair from poor. This is the Widget Effect: a tendency to treat all teachers as roughly interchangeable, even when their teaching is quite variable. Consequently, teachers are not developed as professionals with individual strengths and capabilities, and poor performance is rarely identified or addressed.” The New Teacher Project, 2009
The Widget Effect in Action: When is teacher effectiveness taken into account?
The Widget Effect in Teacher Evaluation: Summary of Findings
When multiple ratings are available, teachers tend to be assigned the highest ratings and are very rarely assigned poor ratings. Evaluation Ratings for Tenured Teachers in Districts with Multiple-Rating Systems
In districts that use binary “Satisfactory/Unsatisfactory” rating systems, the “Unsatisfactory” rating is almost never used. Evaluation Ratings for Tenured Teachers in Districts with Binary Rating Systems
Teachers report not enough is being done to recognize and retain top performers as measured by their impact on student learning. 59% of teachers report their district is not doing enough to identify, recognize, compensate, promote and retain the most effective teachers as measured by their impact on student learning. “All the good quality teachers leave the district after just a few years. They need more incentive to stay.” “Some sort of recognition or praise would be nice. Those doing a good or great job are never told so.” “If you pay the shining stars the same as the slackers, you will dim the shining stars and reinforce the sloth of the slackers.” “I, and others, work hard because we have a conscience, but I don't think [the district] sees us as any different than the lower performing teachers. Teachers who work hard receive very little praise or notice.” TNTP survey of 7,318 teachers across four sites conducted May 2008 to April 2009
Weak evaluation practices and systems mean that many teachers receive little meaningful feedback. 39% of Denver teachers who had a development area identified on their most recent evaluation “do not know” which performance standard they failed to meet. Source1: TNTP survey of 15,176 teachers across 12 sites conducted May 2008 to April 2009 Source2: TNTP survey of 1,863 Denver Public School teachers conducted November to December 2008
Teachers and principals agree that poor instruction is pervasive. “Are there tenured/non-probationary teachers in your school who deliver poor instruction?” (Percent responding “Yes”) Percent of All Ratings that Indicated “Unsatisfactory” Performance Source: TNTP survey of 7,318 teachers across 4 sites conducted February to April 2009
Yet dismissal for poor instructional performance virtually never occurs. Frequency of Teacher Dismissals for Performance (Non-Probationary Teachers) Note: During the time period 2003-04 through 2007-08, Toledo Public Schools had five informal dismissals of tenured teachers (i.e., tenured teachers who were recommended for dismissal but elected to resign or retire instead). Data on informal dismissals were not available for all districts studied.
Our recommendations are a call to action for school districts to move beyond treating teachers like widgets. ADOPT acomprehensive performance evaluation system that fairly, accurately and credibly differentiates teachers based on their effectiveness in promoting student achievement and provides targeted professional development to help them improve. TRAIN administrators and other evaluators in the teacher performance evaluation system and hold them accountable for using it effectively. INTEGRATE the performance evaluation system with critical human capital policies and functions such as teacher assignment, professional development, compensation, retention and dismissal. ADDRESSconsistentlyineffective teaching through dismissal policies that provide lower-stakes options for ineffective teachers to exit the district and a system of due process that is fair but efficient. RECOMMENDATIONS 1 2 “Education reform will go nowhere until the states are forced to revamp corrupt teacher evaluation systems that rate a vast majority of teachers as ‘excellent,’ even in schools where children learn nothing.” Editorial (6.10.09) 3 4
TNTP proposes a new evaluation framework designed to provide credible data on teacher effectiveness. Set performance standards in areas that are most closely tied to student learning. Measureteacher effectiveness and trajectory against performance standards. Benchmark teacher effectiveness and trajectory ratings against minimum expectations for the teacher’s experience level. Use combined evaluation ratings, benchmarked against years of experience, to determine evaluation outcomes.
DCPS’ new evaluation framework (IMPACT) places significant weight on student growth data. Evaluation Weights (Tested Grades and Subject Areas) Evaluation Weights (Non-tested Grades and Subject Areas) SVA 5% SVA 5% CSC 5% CSC 5% NVA 10% TLF 40% IVA – Individual value add NVA – Non-value-added student achievement growth CSC - Commitment to the school community TLF - Teaching and Learning Framework SVA - School value add
A teacher’s total IMPACT score is used to determine his/her final rating. 100 points 175 points 250 points 350 points 400 points
New Haven Evaluation and Development Timeline Situational feedback conversations; student data reviews and data team meetings Evaluation Instructional Rounds and/or full-period classroom observations Mid-year check-in conference, informed by all available data End of year summative evaluation conference Beginning of year goal-setting conference Self-assessment and discuss next year’s professional focus areas Aug Sep Oct Nov Dec Jan Feb Mar Apr May Jun Self-assessment and develop professional focus areas Self-assessment and revisit professional focus areas Development Targeted development activities (i.e., coaching, co-teaching, etc.) Professional Learning Community (PLC) meetings and feedback sessions Note: Additional evaluation and development activities for non-tenured teachers, developing teachers, and/or teachers in need of improvement (such as mentoring from coaches, progress check-ins with instructional managers, additional conferences, etc) are proposed in greater frequency but do not appear in the timeline above.
New Haven Summative Ratings The ratings for the three evaluation components will be synthesized into a final summative rating at the end of each year. Student growth outcomes will play a preponderant role in the synthesis. *Note: Instructional Practices will make up 80 percent of the combined Instructional Practices and Professional Values rating. Professional Value will account for 20 percent. While the end-of-year summative rating is the official rating on record, all teachers should be aware of what that summative rating will be, based on ongoing situational feedback, as well as feedback received at each evaluation and development conference throughout the year.
For more information: www.tntp.org