Download
1 / 1
10 likes | 163 Views
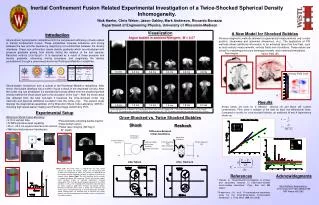
Vector Field. Inertial Confinement Fusion Related Experimental Investigation of a Twice-Shocked Spherical Density Inhomogeneity. Vorticity Field. Nick Haehn, Chris Weber, Jason Oakley, Mark Anderson, Riccardo Bonazza Department of Engineering Physics, University of Wisconsin-Madison. A.

E N D
Vector Field Inertial Confinement Fusion Related Experimental Investigation of a Twice-Shocked Spherical Density Inhomogeneity. Vorticity Field Nick Haehn, Chris Weber, Jason Oakley, Mark Anderson, Riccardo Bonazza Department of Engineering Physics, University of Wisconsin-Madison A Visualization A New Model for Shocked Bubbles Introduction Argon bubble in ambient Nitrogen; M = 2.07 Previous diagnostic methods allowed for geometrical measurements only (vortex position, streamwise and spanwise dimensions, etc.). The application of PIV methods allows additional information to be extracted about the flow field, such as local velocity measurements, vorticity fields and circulations. These values are critical for validating previously developed models and numerical simulations. Shock-driven hydrodynamic instabilities limit the compression efficiency of fuels related to Inertial Confinement Fusion. These instabilities increase turbulence and mixing between the fuel and the capsule by magnifying non-uniformities between the density interfaces. These non-uniformities create density gradients which are misaligned with pressure gradients arising from shocks during the ablation of the fuel capsule. Baroclinic vorticity ((ρ×p)/ρ2 0) is deposited as a result of these pressure and density gradients, enhancing mixing processes and magnifying the density perturbations through a phenomena known as Richtmyer-Meshkov Instabilities. Shock-bubble interactions form a subset of the Richtmyer-Meshkov Instabilites. After shock, the bubble develops into a vortex ring as a result of the deposited vorticity. After the vortex ring has developed, it’s translational velocity differs from the shocked particle velocity behind the shock wave due to the circulation of the ring1,2. After the shock wave has reflected from the tube end-wall, it traverses the once-shocked vortex ring (reshock) and deposits additional circulation onto the vortex ring. The present study displays the diagnostical capabilities of the Wisconsin Shock Tube Laboratory (WiSTL), including high speed planar imaging and Particle Image Velocimetry (PIV). Raw Images -0.2 ms 0.0 ms 0.2 ms 0.6 ms 0.8 ms 0.4 ms No Mixing or Turbulence Mixing and Turbulence Stationary Bubble Translating Vortex Ring Particle Velocity is zero Particle Velocity is non-zero Well Defined Interfaces Diffuse Interfaces No Initial Circulation Initial Circulation • Wisconsin Shock Tube Laboratory: • 9.13 m vertical tube • 20 MPa impulsive load capability • 25.4 × 25.4 cm square internal cross section • Wall mounted pressure transducers Results • Pneumatically retracting bubble injector • False bottom option • Planar laser imaging (Nd:Yag or • Ar+Laser) 1.0 ms 1.2 ms 1.4 ms 1.8 ms 2.0 ms 1.6 ms Radiative heating Ablation Compression Thermo-nuclear burn Shown below are plots for 5 different Atwood (A) and Mach (M) number combinations. Plots show a collapse of the data for early non-dimensional times. Compared to results for once-shocked bubbles, an additional M and A dependence shows up. Image sequence for an Ar bubble in N2 impacted by an initial shock wave of strength of Mi = 2.07 and a reflected shock wave of strength Mr = 1.74. The sequence was recorded at 10,000 fps. Reshock occurs at t = 0.0. The images correspond to a viewing area of 8.3 x 16.6 cm. Experimental Setup Once-Shocked vs. Twice Shocked Bubbles Shock Reshock Difference Between Initial Conditions After Shock After Reshock • Above Left: The initial shock is imaged with two high speed cameras to capture the location, shape, size and position with respect to the imaging laser sheet. The cameras are aligned 90º to one another and are recorded at 250 fps to capture the time of the incident shock. Above Right: The initial condition for the reshock is imaged with planar Mie scattering. Shown left are two sample initial condition images for separate experiments showing repeatability. With the high speed imaging experiments, the initial condition is seen as the shocked vortex ring enters from the top of the video sequence. Left: After reshock, the particle velocity behind the reflected shock wave is nearly zero, therefore, any vortex motion should be primarily a result of circulation. The high-speed imaging offers an excellent way to measure the vortex velocity and extract experimental circulation values using Kelvin’s Circulation theorem. References Acknowldegments Y 1 Ranjan, D., “Experimental investigation of primary and secondary features in high-mach-number shock-bubble interaction,” Phys. Rev. Lett. 98, (2007). 2 Niederhaus, J.H., et al, “A computational parameter study for the three-dimensional shock-bubble interaction”, J. Fluid Mech. 594, 85 (2008). Yre Work Partially Supported by: DOE Grant DE-FG52-06NA26196 NSF Award 0827285 Mi Mr