Download
1 / 52
550 likes | 677 Views
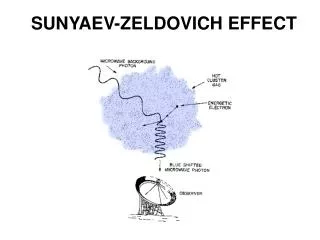
The Sunyaev-Zel’dovich effect: background and issues. Mark Birkinshaw University of Bristol. 1. Simple observables: shape. The SZ effects are the results of inverse-Compton scattering by hot electrons on cold CMB photons.

E N D
The Sunyaev-Zel’dovich effect:background and issues Mark Birkinshaw University of Bristol
1. Simple observables: shape The SZ effects are the results of inverse-Compton scattering by hot electrons on cold CMB photons. The principal (thermal) SZ effect has an amplitude proportional to the Comptonization parameter, ye, the dimensionless electron temperature weighted by the scattering optical depth Mark Birkinshaw, U. Bristol
1. Simple observables: shape For a simple isothermal model • Typical central value ye0 10-4 • SZE has larger angular size than X-ray image and weaker dependence on Mark Birkinshaw, U. Bristol
1. Simple observables: spectrum For clusters which aren’t too hot, or at low frequency, the thermal SZE has the Kompaneets spectrum x is the dimensionless frequency, h/kBTCMB = 0.0186(/GHz) I0 is the specific intensity scale from the thermal SZE Mark Birkinshaw, U. Bristol
1. Simple observables: spectrum • spectrum related to gradient of CMB spectrum • zero near peak of CMB spectrum (about 220 GHz) Mark Birkinshaw, U. Bristol
1. Simple observables: kinematic SZE If the cluster is moving, then in the cluster frame the CMB is anisotropic. Scattering isotropizes it by an amount evz, giving kinematic SZE Same as spectrum of primordial CMB fluctuations: TCMB change. Mark Birkinshaw, U. Bristol
1. Simple observables: kinematic SZE • spectrum related to gradient of CMB spectrum • no zero • small compared to thermal effect at low frequency • confused by primordial structure Mark Birkinshaw, U. Bristol
2. Simple observations • Prime focus: • single on-axis feed • symmetrical dual feeds Simplest: single-dish radiometers/radiometer arrays. • Secondary focus: • single on-axis feed • symmetrical dual feeds • array of feeds (large focal plane) Mark Birkinshaw, U. Bristol
2. Simple observations: radiometer sensitivity Always observe with beam-switching + position-switching, or scanning, or some other strategy to reduce systematic errors. Sensitivity expected to be (N > 1), but TA doesn’t reduce with time as -1/2 after some limiting time, because gain and Tsys are unsteady. Mark Birkinshaw, U. Bristol
2. Simple observations: z dependence Angular size and separation of beams leads to redshift dependent efficiency Shape of curve shows redshift of maximum signal, long plateau Mark Birkinshaw, U. Bristol
2. Simple observations: radiometer results • fast at measuring integrated SZ effect of given cluster • multi-beam limits choice of cluster, but subtracts sky well • radio source worries • less used since early 1990s • new opportunities, e.g. GBT, with radiometer arrays Birkinshaw 1999 Mark Birkinshaw, U. Bristol
2. Simple observations: interferometers OVRO array in compact configuration (old site). Mark Birkinshaw, U. Bristol
2. Simple observations: interferometer sensitivity Sensitivity of interferometer Ncorr = number of antenna-antenna correlations used in making synthesized beam (solid angle synth). source = solid angle of source. Mark Birkinshaw, U. Bristol
2. Simple observations: interferometer baselines • restricted angular dynamic range set by baseline and antenna size • good rejection of confusing radio sources (can use long baselines) available baselines Abell 665 model, VLA observation Mark Birkinshaw, U. Bristol
2. Simple observations: interferometer maps First interferometric detection of SZE: Ryle telescope, Abell 2218 Jones et al. (1993) Mark Birkinshaw, U. Bristol
2. Simple observations: interferometer maps • restricted angular dynamic range • high signal/noise (long integration possible) • clusters easily detectable to z 1 Carlstrom et al. 1999 Mark Birkinshaw, U. Bristol
2. Simple observations: interferometer maps VSA: low-z clusters About 100 hours/map High signal/noise detection Apparent noise is confusion from CMB primordial fluctuations – limitation of all single-frequency work Lancaster et al. (2004; astro-ph/0405582) Mark Birkinshaw, U. Bristol
2. Simple observations: bolometers A good alternative is bolometric observation using an array: e.g., BOLOCAM on CSO; ACBAR on Viper. Issues to do with the stability of the atmosphere. mm-wave data – good for looking at spectrum. Mark Birkinshaw, U. Bristol
2. Simple observations: bolometer maps • A 3266: z = 0.06 • VIPER +ACBAR • Images at 150, 220, 275 GHz, 5 arcmin FWHM • Remove CMB to leave thermal SZE (bottom right) Gómez et al. 2003 Mark Birkinshaw, U. Bristol
3. Simple science results • Integrated SZ effects • total thermal energy content • total hot electron content • SZ structures • not as sensitive as X-ray data • need for gas temperature • Mass structures and relationship to lensing • Radial peculiar velocity via kinematic effect Mark Birkinshaw, U. Bristol
3. Simple science results: integrated SZE • Total SZ flux density Thermal energy content immediately measured in redshift-independent way Virial theorem: SZ flux density should be good measure of gravitational potential energy Mark Birkinshaw, U. Bristol
3. Simple science results: integrated SZE • Total SZ flux density If have X-ray temperature, then SZ flux density measures electron count, Ne (and hence baryon count) Combine with X-ray derived mass to get fb Mark Birkinshaw, U. Bristol
3. Simple science results: SZE structures • Only crudely measured so far • Relatively more sensitivity to outer parts of clusters than X-ray data • Angular dynamic range issue: limitation of array sizes (radiometer, interferometer, bolometer), and CMB confusion • Will need sensitivity at Jy level on 10 arcsec to 120 arcsec scales Mark Birkinshaw, U. Bristol
3. Simple science results: SZE and lensing Weak lensing measures ellipticity field e, and so Surface mass density as a function of position can be combined with SZ effect map to give a map of fb SRJ/ Mark Birkinshaw, U. Bristol
3. Simple science results: total, gas masses Inside 250 kpc: XMM +SZ Mtot = (2.0 0.1)1014 M Lensing Mtot = (2.7 0.9)1014 M XMM+SZ Mgas = (2.6 0.2) 1013 M CL 0016+16 with XMM Worrall & Birkinshaw 2003 Mark Birkinshaw, U. Bristol
3. Simple science results: vz • Kinematic effect separable from thermal SZE by different spectrum • Confusion with primary CMB fluctuations limits vz accuracy (typically to 150 km s-1) • Velocity substructure in atmospheres will reduce accuracy further • Statistical measure of velocity distribution of clusters as a function of redshift in samples Mark Birkinshaw, U. Bristol
3. Simple science results: vz Need • good SZ spectrum • X-ray temperature Confused by CMB structure Sample vz2 Errors 1000 km s so far A 2163; figure from LaRoque et al. 2002. Mark Birkinshaw, U. Bristol
3. Simple science results: cosmology • Cosmological parameters • cluster-based Hubble diagram • cluster counts as function of redshift • Cluster evolution physics • evolution of cluster atmospheres via cluster counts • evolution of radial velocity distribution • evolution of baryon fraction • Microwave background temperature elsewhere in Universe Mark Birkinshaw, U. Bristol
3. Simple science results: cluster Hubble diagram X-ray surface brightness SZE intensity change Eliminate unknown ne to get cluster size L, and hence distance or H0 Mark Birkinshaw, U. Bristol
3. Simple science results: cluster distances CL 0016+16 DA = 1.36 0.15 Gpc H0 = 68 8 18 km s-1 Mpc-1 Worrall & Birkinshaw 2003 Mark Birkinshaw, U. Bristol
3. Simple science results: cluster Hubble diagram • poor leverage for other parameters • need many clusters at z > 0.5 • need reduced random errors • ad hoc sample • systematic errors Carlstrom, Holder & Reese 2002 Mark Birkinshaw, U. Bristol
3. Simple science results: SZE surveys • SZ-selected samples • almost mass limited and orientation independent • Large area surveys • 1-D interferometer surveys slow, 2-D arrays better • radiometer arrays fast, but radio source issues • bolometer arrays fast, good for multi-band work • Survey in regions of existing X-ray/optical surveys • Expect SZ to be better than X-ray at high z Mark Birkinshaw, U. Bristol
3. Simple science results: SZE sky SZ sky predicted using structure formation code (few deg2, y = 0 – 10-4) Primordial fluctuations ignored Cluster counts strong function of cosmological parameters and cluster formation physics. Mark Birkinshaw, U. Bristol
3. Simple science results: SZE sky See talks of Stefano Borgani Scott Kay Antonio da Silva Lauro Moscardini Jim Bartlett Joseph Silk Mark Birkinshaw, U. Bristol
3. Simple science results: fB SRJ Ne Te Total SZ flux total electron count total baryon content. Compare with total mass (from X-ray or gravitational lensing) baryon mass fraction b/m Figure from Carlstrom et al. 1999. Mark Birkinshaw, U. Bristol
4. More complicated observables • Detailed structures • Gross mass model • Clumping • Shocks and cluster substructures • Detailed spectra • Temperature-dependent/other deviations from Kompaneets spectrum • CMB temperature • Polarization • Multiple scatterings • Velocity term Mark Birkinshaw, U. Bristol
4. More complicated observables: detailed structures Clumping induced by galaxy motions, minor mergers, etc. affects the SZE/X-ray relationship More extreme structures caused by major mergers, associated with shocks, cold fronts Further SZE (density/temperature-dominated) structures associated with radio sources (local heating likely), cooling flows, large-scale gas motions (kinematic effect). Mark Birkinshaw, U. Bristol
4. More complicated observables: detailed structures J0717.5+3745 z = 0.548 Clearly disturbed, shock-like substructure, filament What will SZ image look like? Mark Birkinshaw, U. Bristol
4. More complicated observables: detailed structures See talks by Monique Arnaud Doris Neumann Steen Hansen Tetsu Kitayama Christoph Pfrommer Andrea Lapi Mark Birkinshaw, U. Bristol
4. More complicated observables: detailed spectra • Ratio of SZ effects at two different frequencies is a function of CMB temperature (with slight dependence on Te and cluster velocity) • So can use SZ effect spectrum to measure CMB temperature at distant locations and over range of redshifts • Test TCMB (1 + z) Battistelli et al. (2002) Mark Birkinshaw, U. Bristol
4. More complicated observables: detailed spectra • for low-Te gas effect is independent of Te • Te > 5 keV, spectrum is noticeable function of Te • non-thermal effect (high energies) gives distortion • multiple scatterings give another distortion 5 keV 15 keV Mark Birkinshaw, U. Bristol
4. More complicated observables: detailed spectra See talks by Francesco Melchiorri Björn Schaeffer Diego Herranz Sergio Colafrancesco Jens Chluba Mark Birkinshaw, U. Bristol
4. More complicated observables: polarization Polarization signals are O(z) or O(e) smaller than the total intensity signals: this makes them extremely hard to measure Interferometers help by rejecting much of the resolved signal, since some of the polarization signal has smaller angular size than I Mark Birkinshaw, U. Bristol
4. More complicated observables: polarization See talks by Doris Neumann Asantha Cooray Jens Chluba Mark Birkinshaw, U. Bristol
5. Requirements on observations Mark Birkinshaw, U. Bristol
5. Requirements on observations Mark Birkinshaw, U. Bristol
5. Requirements on observations Mark Birkinshaw, U. Bristol
6. Status at the time of ALMA: 2005 Current status • About 100 cluster detections • high significance (> 10) detections • multi-telescope confirmations • interferometer maps, structures usually from X-rays • Spectral measurements still rudimentary • no kinematic effect detections • Preliminary blind and semi-blind surveys • a few detections Mark Birkinshaw, U. Bristol
6. Status at the time of ALMA: 2005-2010 See talks by Rüdiger Kneissl Guo-Chin Liu Katy Lancaster Pierre Cox Frank Bertoldi John Carlstrom Björn Schaefer … and other SZ instrumentation projects Mark Birkinshaw, U. Bristol
6. Status at the time of ALMA: 2010 • About 5000 cluster detections • Most from Planck catalogue, low-z • 10% from high-resolution surveys (AMiBA, SZA, BOLOCAM, etc.) • About 100 images with > 100 resolution elements • Mostly interferometric, tailored arrays, 10 arcsec FWHM • Some bolometric maps, 15 arcsec FWHM • About 50 integrated spectral measurements • Still confusion limited • Still problems with absolute calibration Mark Birkinshaw, U. Bristol