Download
1 / 21
210 likes | 230 Views
Explore the economic growth potential and trade opportunities in Central and Eastern European countries that were formerly under the sway of the Soviet Union. Discover the impact of FDI and the benefits of boosting trade for growth and job creation.

E N D
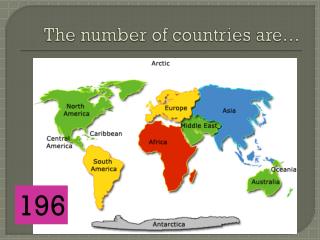
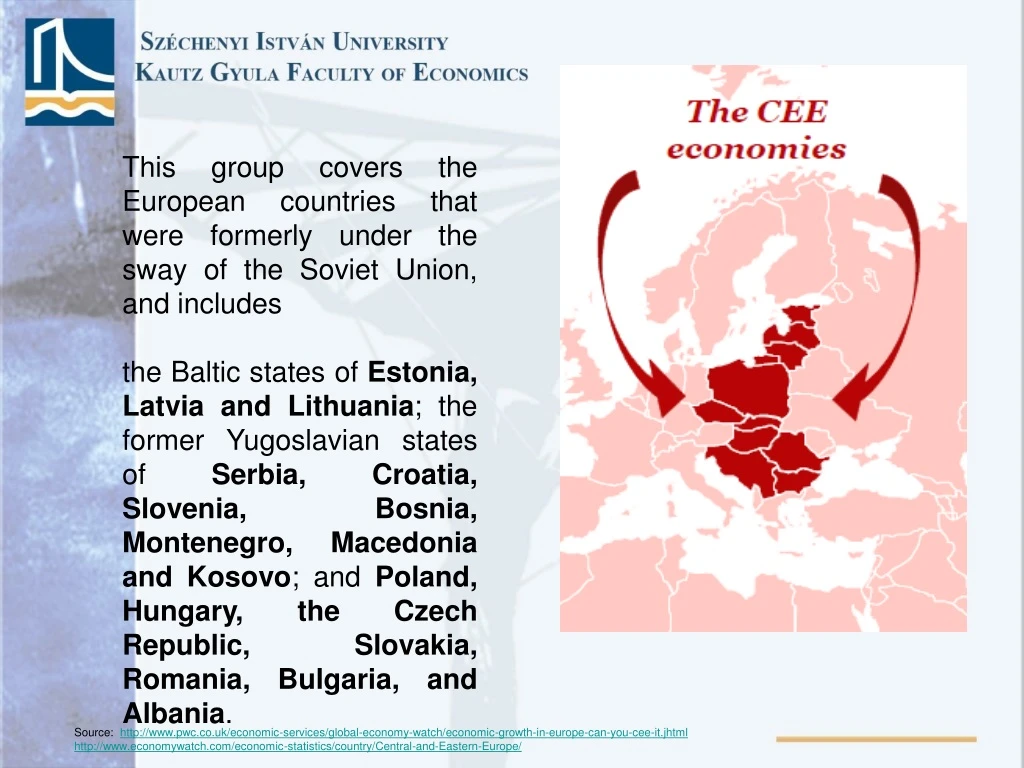
This group covers the European countries that were formerly under the sway of the Soviet Union, and includes the Baltic states of Estonia, Latvia and Lithuania; the former Yugoslavian states of Serbia, Croatia, Slovenia, Bosnia, Montenegro, Macedonia and Kosovo; and Poland, Hungary, the Czech Republic, Slovakia, Romania, Bulgaria, and Albania. Source: http://www.pwc.co.uk/economic-services/global-economy-watch/economic-growth-in-europe-can-you-cee-it.jhtml http://www.economywatch.com/economic-statistics/country/Central-and-Eastern-Europe/
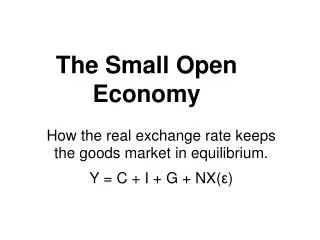
The majority of CEE countries are • small, • relatively open and • heavily dependent on exports for growth, notably to other EU countries. This makes them highly sensitive to developments in advanced economies.(Mateusz Walewski)
The CEE economies can be grouped into three camps. 1, The smaller economies of the Baltic States were most severely affected by the crisis (annual GDP fell by 15% in 2009), but they are also now bouncing back most strongly. 3.5-4% GDP growth per annum over the next 5 years. (ES,LA,LI – 2.99; 4.16; 3.04 - 2013)
2, Next are larger economies, like Bulgaria, Romania and Poland, which are export focused with a reasonably friendly business environment and good stock of human capital. 2-3% GDP growth per annum over the next 5 years. BL,RO,PL 1.2, 1.59, 1.31 (2013)
3, Finally, there are some problematic stragglers like Hungary (high public debt 74-80% net-gross) and Slovenia (high private debt), which will struggle to reach 1.5% average growth over the next 5 years. HU, SL -0.01, -1.99 (2013)
The Inward FDI Contribution Index aims to measure the development impact of FDI in the host economy. Itlooks at the contribution of foreign affiliates to GDP (value added), employment, wages and salaries, exports, R&D expenditures, capital formation and tax payments, as a share of the host-country total (e.g. employment byforeign affiliates as a percentage of total employment). A number of these variables are also proposed by the G-20 in its work on indicators for measuringand maximizing economic value added and job creation arising from private sector investment in value chains.
According to this year’s (2012) index – thefirst of its kind – the host economy with the largestcontribution by FDI is Hungary, followed by Belgiumand the Czech Republic. Looking at regional patterns in the ContributionIndex shows that there are more host countrieswith higher index values in the developing regions. In “high contribution” (top quartile) countriesTNC foreign affiliatescontribute about half of their GDP (in value added)and exports, about one fifth of employment
In “high contribution” (top quartile) countriesTNC foreign affiliatescontributesignificantly higher values for three indicators: wages (with TNCs accounting for a large share offormal employment and paying higher wages thanlocal firms), R&D spending (with TNCs accountingfor nearly 70 per cent of some countries’ registeredR&D), and capital expenditures (in total gross fixedcapital formation)
Ghemawat, Pankaj.: "Distance Still Matters: The HardReality of Global Expansion."Harvard Business Review79, no. 8 (September 2001): 137-147. • The CAGE framework of distance presented here considers four attributes: • cultural distance (religious beliefs, race, social norms, and language); • 2. administrative or political distance (colony-colonizer links, common currency, and trade arrangements);
3.geographic distance (the physical distance between the two countries, the size of the target country, access to waterways and the ocean, internal topography, and transportation and communications infrastructures); and 4. economic distance (disparities in the two countries' wealth and variations in the cost and quality of financial and other resources).
TRADE CAN BE A POWERFUL ENGINE FOR GROWTH AND JOB CREATION IN EUROPE Boosting trade is one of the few ways to bolster economic growth without drawing onseverely constrained public finances. The contribution of external demand to GDP is the EU's most important source of growth for the moment, as domestic demand components - both publicand private - remain weak. http://trade.ec.europa.eu/doclib/docs/2013/april/tradoc_151052.pdf
In fact, the contribution of trade to GDP in 2012 (+0.9 percentagepoints) cut the depth of the recession in the EU by a factor of four, helping compensate for thedownward pull of domestic demand and inventories (-1.2 points). The contribution of externaldemand to economic growth is bound to increase in future, as 90 % of global economic growth inthe next 10-15 years is expected to be generated outside Europe, a third of it in China alone. Tobe sustainable, economic recovery will need to be consolidated through stronger links with thenew centres of global growth. http://trade.ec.europa.eu/doclib/docs/2013/april/tradoc_151052.pdf
Long-term evidence from EU countries shows that a 1 % increase inthe openness of the economy leads to an increase of 0.6 % in labour productivity. By operating on both supply and demand, trade is a powerful tool to boost economicgrowth. Trade policy is therefore an essential component of the EU’s growth compact. Moretrade is also essential to job creation: About 30 million jobs in the EU depend on sales to the restof the world, an increase of 10 million since 1995. On average, each additional €1 billion ofexports supports 15000 additional jobs across the EU. http://trade.ec.europa.eu/doclib/docs/2013/april/tradoc_151052.pdf
In recent years, despite difficulties in moving forward in the multilateral context, we havenot stood still in the face of rapid changes in the global economy. We have developed a tradepolicy agenda of an unprecedented scale: while less than a quarter of EU trade was covered byFree Trade Agreements (FTAs) before 2006, concluding on-going negotiations would bring thisfigure up to half of our trade and we are now accelerating and deepening this agenda with theopening of negotiations for an agreement on a far bigger scale with Japan and the possibility ofgoing down the same road in the near future with the US. Completing this agenda would bring thecoverage of our trade by FTAs to two-thirds of EU external trade. This is by far the mostambitious trade agenda in the world today. http://trade.ec.europa.eu/doclib/docs/2013/april/tradoc_151052.pdf
These negotiations could boost EU GDP by more than 2% or €250bn — equivalent to thesize of the Austrian or Danish economy — and support an increase of more than 2 millionjobs related to trade across the EU. This focus on an ambitious bilateral trade agenda has already produced results with thesuccessful implementation of a new-generation FTA with Korea and the conclusion of similaragreements with Colombia, Peru, Central America, Ukraine and most recently, Singapore. Negotiations with Canada are also close to finalisation. Deep andcomprehensive FTA negotiations are on-going or soon to be launched with Georgia, Moldova andArmenia, as well as with Egypt, Jordan, Morocco and Tunisia. http://trade.ec.europa.eu/doclib/docs/2013/april/tradoc_151052.pdf
http://trade.ec.europa.eu/doclib/docs/2013/april/tradoc_151052.pdfhttp://trade.ec.europa.eu/doclib/docs/2013/april/tradoc_151052.pdf