Download
1 / 29
290 likes | 418 Views
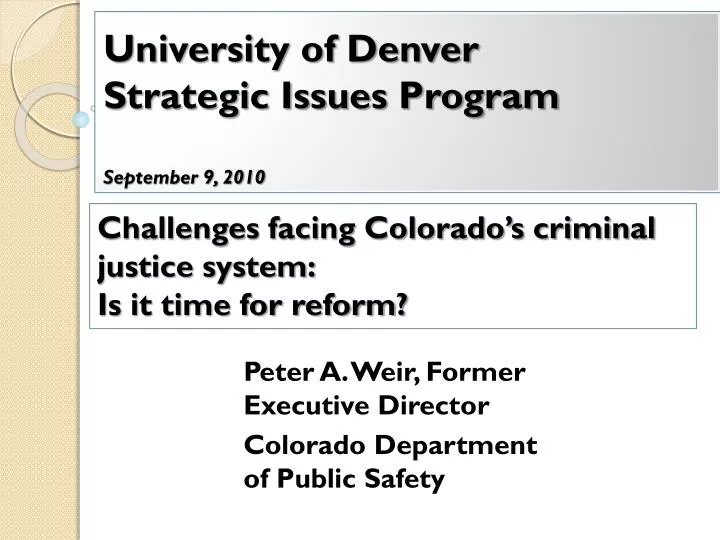
University of Denver Strategic Issues Program September 9, 2010. Peter A. Weir, Former Executive Director Colorado Department of Public Safety. Challenges facing Colorado’s criminal justice system: Is it time for reform?. Challenges facing government. Budget shortfalls Budget shortfalls

E N D
University of DenverStrategic Issues ProgramSeptember 9, 2010 Peter A. Weir, Former Executive Director Colorado Department of Public Safety Challenges facing Colorado’s criminal justice system: Is it time for reform?
Challenges facing government Budget shortfalls Budget shortfalls Budget shortfalls Budget shortfalls Budget shortfalls
Challenges facing government:Budget shortfalls Over the past three years, the governor and legislature have cut shortfalls totaling $4.3 billion The federal government has provided $1.6 billion over the past three years to help Colorado balance the budget. Gov. Ritter said without the federal funding, he would have been forced to cut another $140 million from public education.
Challenges facing government: Budget shortfalls Gov. Ritter is reluctantly using money from medical marijuana registrations to help the state meet a $60 million budget shortfall. The September revenue forecast will be used to help shape Ritter's budget for next year, due Nov. 1. Previous forecasts have indicated a $500 million to $1 billion shortfall in FY2011-12, meaning more tough decisions must be made
GAO forecasts: Discouraging through 2050 1980 1985 1990 1995 2000 2005 2010 2015 2020 2025 2030 2035 2040 2045 2050
Four largest areas of state spending • K-12 education • Higher education • Corrections • Medicaid
Challenges: Budget shortfall • Colorado spends 9 percent of its total general fund expenditures on corrections. • Between 1987 and 2007, Colorado posted the second highest increase (5.1 percent) in the proportion of correctional spending in the U.S. • The DOC budget for fiscal year 2011 is over $730 million. • In 2007, about 20 percent of Colorado’s prison beds were occupied by people who had failed parole.
Colorado crime rates and justice system expenditures - 1982-2005
Colorado incarceration rates1980-2005 CO doubled sentencing ranges in 1985
Percentage Increase: Number of Sentenced Prisoners, Selected States,1990-2002 224% 216% 190% 171% 146% 141% 131% 124% 123% 116% 114% 132% 101% 97% 90% 80% 68% 67% 55% 48% 47% 37% 35% 32% 25% 22% Texas Idaho W. Va Miss CO Tenn MT ND MN Utah SD HI Iowa WA NV OK PA AK Calif IL MI RI SC MD NJ Maine NY Texas-------224% Colorado--145% New York---22% Overall state average------80% From: Michael Jacobson (2005), Downsizing Prisons, p. 33
Why the increase? Longer sentences More admissions Increase in parole and probation violators Increase in drug offenders Nationwide, convictions increased about 18% in the 1990s and prison admissions increased about 60% SOURCE: Mark Mauer (2007). The hidden problem of time served in prison. Social Research, Vol. 74, No. 2, page701. (Sentencing Project website)
Percent of Americans Who Prefer Tougher Approach to Crime or Tougher Approach to the Causes of Crime 1994 and 2001 Michael Jacobson (2005), Downsizing Prisons; Source: Peter D. Hart Research Associates, Inc. (2002) The New Politics of Criminal Justice, Washington, D.C.
Challenges • In July, 22,813 were in prison and 9,000 were on parole (500 fewer in prison than one year ago) • 11,000 people entered prison each year and serve about 22 months • 10% of the DOC population in FY2009 was serving time for a parole technical violation • 49% of the population are past their parole eligibility date • 78% have substance abuse problems; 23% require sex offender treatment; 61% have vocational problems; 30% have academic problems. July 2010 Statistical Bulletin; Colorado Department of Corrections Statistical Report, FY 2009
Challenges: Cost and Success Rates Average cost of prison: $32,300/year 3-year return-to-prison rates: 53% New crime: 18% Technical violation: 35% 22% is the return-to-prison rate when NOT released on parole (new crimes) Colorado Department of Corrections Statistical Report, FY 2009
Colorado’s CJS: Challenges • Cost of imprisonment • Lack of effectiveness of imprisonment, based on recidivism rates • Implementation of established Evidence Based Practices to reduce recidivism Method to address challenges: Colorado Commission on Criminal and Juvenile Justice
“Are you just pissing and moaning or can you verify what you’re saying with data?”
Colorado Commission on Criminal and Juvenile Justice • Established in 2007, began work in 2008 • Multidisciplinary membership of 26 professionals • Mandated to focus on evidence-based recidivism reductionand cost effective expendituresof limited criminal justice funds • Mandated to assess the effectiveness of sentences imposed to meet the purposes of sentencing and the need to prevent recidivism and re-victimization C.R.S. 16-11.3-103
Pyramid of Evidence-Based Practices National Academy of Sciences National Research Council 2008 Report on Parole, Desistance from Crime, and Community Integration. Statistical method that synthesizes many individual studies into one large study with many subjects; adheres to pre-established protocol to select studies; calculates an average effect size to reduce bias and ensure comprehensiveness. Pyramid source: Co-Occurring Center for Excellence (COCE), funded through the Substance Abuse and Mental Health Services Administration (SAMHSA). Available at http://www.coce.samhsa.gov/cod_resources/PDF/OP5-Practices-8-13-07.pdf Most Colorado studies of criminal justice programs Anecdotal events often drive policy
Evidence: Does incarceration reduce the crime rate? The empirical evidence is increasingly clear that the increased use of incarceration for low-rate, non-violent offenders prevents and deters few crimes. PUNISHMENT Employment, marriage, and aging are linked to desistance from crime. Public policies that block employment and other opportunities for ex-offenders to resume a regular life in the community eventually lead to higher rates of failure. SEALING OF RECORDS
Evidence: The time immediately following release from prison is the riskiest for the offender and the public Assessing risk and service needs of offenders at the point of release (DOC), Targeting services that meet at least 5 of the offenders most pressing needs (housing, employment, substance abuse treatment, antisocial peer associations, and criminal attitudes) in the weeks and months immediately following release, and Provides the most cost-beneficial approach to reducing recidivism and increasing public safety
Evidence: Based on 30 years of research (handout) Eight Evidence-Based Principles for recidivism reduction in corrections #1. Assess offender risk/needs using actuarial scales. 2. Enhance intrinsic motivation—help offenders engage in treatment. 3. Target interventions. a. Risk Principle: Prioritize supervision and treatment resources for higher risk offenders. b. Need Principle: Target interventions to criminogenic needs. c. Responsivity Principle: Be responsive to temperament, learning style, motivation, culture, and gender when assigning programs. d. Dosage: Structure 40-70% of high-risk offenders’ time for 3-9 months. e. Treatment: Integrate treatment into the full sentence/sanction requirements. 4. Skill train with directed practice (use cognitive behavioral treatment methods). 5. Increase positive reinforcement (4 positive for every negative sanction). 6. Engage ongoing support in natural communities. # 7. Measure relevant processes/practices. 8. Provide measurement feedback: Client outcomes and quality of service delivery National Institute of Corrections nicic.org
Example EBP #1 Assess offender needs and risk levels
Example: Colorado Actuarial Risk Assessment Scale for Parole Release
Legislation2010 • HB 10-1352 Controlled Substance and Marijuana Penalties • Rep. Waller • Sen. Steadman • HB 10-1360 Parole Placement for Technical Violation • Rep. Pace • Sen. Steadman • HB 10-1374 Parole Changes Evidence-Based Practices • Rep. Ferrandino • Sen. Penry
Challenge Implementation of Evidence-Based Practices (EBP) to reduce recidivism Changing organizational culture Parole Board Technical Violations Parole Officer Introductory training all disciplines and levels of management Ongoing training for line staff Ongoing evaluation (research) to ensure implementation
Challenge: Changing organizational cultures to implement EBP #7. Measure relevant processes and practices. What data is collected regarding inmate/offender assessment and case management? Is the information reliable? Is it adequate to answer questions about adhering to evidence based practices? Is the information easily retrievable so that managing staff can review their efforts? How are incremental inmate/offender changes measured while they are incarcerated and under supervision? What are the outcome measures and how are they tracked? Are staff performance evaluations based on use of evidence based practices and successful supervision techniques? How is staff performance measured? What data is used? How is that data collected? How is it used to provide feedback to the parole officer or case manager? When practices are not well implemented, what is the approach for improvement? National Institute of Corrections nicic.org
Recommendations • Resources for training and research are cut during budget reductions • Decisions need to be linked to both research and public expenditures • Need to develop research-based performance measures • Common goal: recidivism reduction • Alternatives to incarceration for appropriateoffenders • $32,000 (cost of one year in prison) can provide significant resources in the community: substance abuse treatment, housing, transportation, supervision costs