Download
1 / 16
180 likes | 351 Views
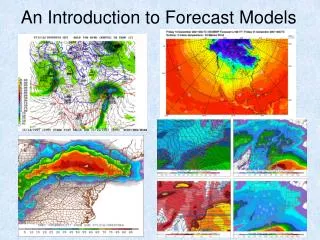
Forecast/ AtmospherIc Soundings. Brad Temeyer. Atmospheric Sounding. Sounding Locations. Weather Maps. Temperature profile. -Plot of temperature vs height -Pressure decreases in atmosphere as you increase in height -Atmospheric pressure decreases logrithmically

E N D
Forecast/AtmospherIc Soundings Brad Temeyer
Temperature profile -Plot of temperature vs height -Pressure decreases in atmosphere as you increase in height -Atmospheric pressure decreases logrithmically -Temperature typically decreases with height in lowest layer of atmosphere Pressure -30C -20C -10 C 0 C 10C 20C Inversion
Temperature profile (cont.) Dry air lines -Dry air cools at a rate of 9.8 degrees C per km (~18 degrees F per 3300 feet) -Once air becomes saturated, it only cools at 8 degrees C per km (~14 degrees F per 3300 feet) Pressure Actual Temp Temperature -30C -20C -10C 0C 10C 20C
Temperature profile (cont.) -Surface Temperature? -Good day to fly? Time Dir SpVisObs Clouds Temp Td Pressure 07:53 SE 5 5.00 Fog/Mist SCT250 16 13 29.91 1014.2 06:53 SE 7 4.00 Fog/Mist BKN200 16 12 29.92 1014.6 05:53 SE 6 4.00 Fog/Mist BKN200 17 13 29.95 1015.4 04:53 SE 6 5.00 Fog/Mist BKN200 17 13 29.97 1016.1 -20C -10C 0C 10C 20C 30C 40C
Wind Barbs 60 kts -Winds are displayed in 5 knot intervals -5 knots is equal to a half a barb -50 knots is represented by a flag 40 kts 5 kts
How do you know when the fast winds aloft will reach the surface? -What is the current surface temp? -1 C (30F) -How warm does the surface need to get before the gusty winds from aloft mix down to the surface? 13 C (~55F) -30C -20C -10C 0C 10C 13C 20C 30C 40C
Pop Quiz -What is the current surface temperature? -How warm does the surface need to get before the gusty winds from aloft mix down to the surface? -20C -10C 0C 10C 20C 30C 40C
Hodographs -Winds speed and direction to a fixed point -NOT a trace of the path of the balloon
BUFKIT http://www.erh.noaa.gov/er/buf/bufkit/bufkit.html