
INTRODUCTION
Joint Solution of Urban Structure Detection from Hyperion Hyperspectral data. Lin Cong, Brian Nutter, Daan Liang Wind Science and Engineering Department of Electrical and Computer Engineering Department of Construction Engineering & Engineering Technology

INTRODUCTION
E N D
Presentation Transcript
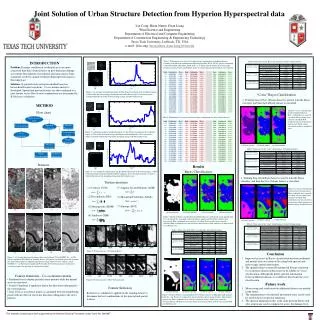
Joint Solution of Urban Structure Detection from Hyperion Hyperspectral data Lin Cong, Brian Nutter, Daan Liang Wind Science and Engineering Department of Electrical and Computer Engineering Department of Construction Engineering & Engineering Technology Texas Tech University, Lubbock, TX, USA e-mail: {lin.cong, brian.nutter, daan.liang}@ttu.edu • INTRODUCTION • Problem: Damage condition of residential areas are more concerned than that of natural areas in post-hurricane damage assessment. Recognition of residential and natural areas from commonly used low-spatial-resolution hyperspectral images is thus important. • Solution: A spatial-feature extraction method based on hierarchical Fourier transform – Co-occurrence matrix is developed. Spatial and spectral features are then combined to a joint feature vector. Best feature combinations are determined by K-fold cross validation. • METHOD Table 1: Performance of a subset of all joint feature combinations for Lubbock dataset. Features are listed in the combinations following the order: PCA1, PCA2, spectral correlation, CON, DIS, HOM, SIM, ASM, MAX, ENT. A “1” means that the feature in the associated position is selected in the combination, and a “0” means that associated feature is not selected. Table 4: Error rates of the Bayes classification for New Orleans dataset (a) (b) (c) (d) Figure 2. (a) A sample of residential region; (b) The Fourier transform of the residential region; (c) Plot of the directional energy distribution in Fourier domain; (d) Co-occurrence matrix calculated with the direction of the maximum energy and offset equal to one; “Cross” Bayes Classification 1. Training data of New Orleans dataset is used to train the Bayes classifier, and then the Lubbock dataset is classified. Figure 9. “Cross” classification results of Lubbock dataset. Blue: residential areas correctly classified; Green: natural areas correctly classified; Red: residential areas misclassifed as natural areas; Pink: natural areas misclassifed as residential areas. (b) (a) Flow chart Table 2: Performance of a subset of all joint feature combinations for New Orleans dataset. Hyperspectral data PCA transform Spectral correlation Fourier Transform (c) (d) Figure 3. (a) Another sample of residential region; (b) The Fourier transform of the residential region; (c) Plot of the directional energy distribution in Fourier domain; (d) Co-occurrence matrix calculated with the direction of the maximum energy and offset equal to one; Co-occurrence matrix PCA components Texture measures Feature selection (a) Purely spectral (b) Purely spatial (c) Joint solution Table 5: Error rates of the “cross” classification for Lubbock dataset (b) (a) Bayes Classification K-means clustering Datasets Results (c) (d) Bayes Classification Figure 4. (a) A sample of natural region; (b) The Fourier transform of the natural region; (c) Plot of the directional energy distribution in Fourier domain; (d) Co-occurrence matrix calculated with the direction of the maximum energy and offset equal to one; 2. Training data of Lubbock dataset is used to train the Bayes classifier, and then the New Orleans dataset is classified. Texture measures (1) Contrast (CON) (5) Angular Second Moment (ASM) Figure 10. “Cross” classification results of New Orleans dataset. Blue: residential areas correctly classified; Green: natural areas correctly classified; Red: residential areas misclassifed as natural areas; Pink: natural areas misclassifed as residential areas. (2) Dissimilarity (DIS) (6) Maximum Probability (MAX) (7) Entropy (ENT) (3) Homogeneity (HOM) (d) (c) (b) (a) (b) Purely spectral (c) Purely spatial (d) Joint solution (a) Ground truth (4) Similarity (SIM) Figure 7. Results of Bayes classification for Lubbock dataset. (a) Manually made ground truth; (b) – (d) Results by using purely spectral features, purely spatial features, joint features, respectively. Blue: residential areas correctly classified; Green: natural areas correctly classified; Red: residential areas misclassifed as natural areas; Pink: natural areas misclassifed as residential areas. (c) Joint solution (b) Purely spatial (a) Purely spectral Table 6: Error rates of the “cross” classification for New Orleans dataset Table 3: Error rates of the Bayes classification for Lubbock dataset SIM MAX HOM ENT DIS ASM CON Figure 5. Texture measures of Lubbock dataset (g) (h) (f) (e) Conclusion Figure 1. (a) Original hyperspectral image taken over Lubbock, TX in 01/2003; (b) – (c) The top two significant PCA bands of Lubbock dataset; (d) Spectral correlation against the spectrum of construction asphalt; (e) Original hyperspectral image taken over New Orleans, LA in 04/2005; (f) – (g) The top two significant PCA bands of New Orleans dataset; (h) Spectral correlation against the spectrum of construction asphalt; Improved accuracy in Bayes classification between residential and natural areas was achieved by using both spectral and macroscopic spatial information. The spatial features extracted by proposed Fourier transform – Co-occurrence matrix method seem to be reliable in “cross” classification, although the purely spectral information between different datasets is so different that it fails the cross classification. Fourier transform – Co-occurrence matrix • Residential areas display periodic street patterns while the natural areas are universal. • Fourier Transform is applied to detect the directions orthogonal to the street patterns. • Gray level co-occurrence matrix is calculated between neighboring pixels with an offset of one in the direction orthogonal to the street patterns. CON ASM MAX ENT HOM SIM DIS Figure 6. Texture measures of New Orleans dataset Future work Feature Selection • More testing and verification on additional datasets are needed in the future. • The segmentations of residential and natural areas can be used for model choice in spectral unmixing. • The spectral unmixing results at the same position before and after a hurricane can be compared to assess the damage level. (a) Ground truth (c) Purely spatial (d) Joint solution (b) Purely spectral K-fold cross validation is applied on the training dataset to determine the best combinations of the spectral and spatial features. Figure 8. Results of Bayes classification for New Orleans dataset. (a) Manually made ground truth; (b) – (d) Results by using purely spectral features, purely spatial features, joint features, respectively. Blue: residential areas correctly classified; Green: natural areas correctly classified; Red: residential areas misclassifed as natural areas; Pink: natural areas misclassifed as residential areas. This material is based upon work supported by the National Science Foundation under Grant No. 0800487


