Download
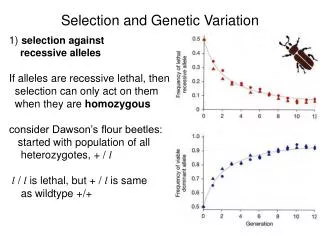
1 / 29
330 likes | 700 Views
Mutation and Genetic Variation. Chapter 4. Mutation is the ultimate source of genetic variation. Point mutations base substitutions, insertions, deletions Gene duplications Changes in chromosome structure inversions, translocations Changes in chromosome number polyploidy.

E N D
Mutation and Genetic Variation Chapter 4
Mutation is the ultimate source of genetic variation • Point mutations • base substitutions, insertions, deletions • Gene duplications • Changes in chromosome structure • inversions, translocations • Changes in chromosome number • polyploidy
Estimated number of mutations per genome per generation (see Table 4.1 of Freeman & Herron)
More on mutation rates • Number of mutations per genome per generation is a function of: • The number of genes • The average number of generations of cell division that precede gamete production • The mutation rates on the previous slide are underestimates of the total mutation rate because they are based only on mutations of “large” effect • Spontaneous mutation rates may be subject to natural selection • Variation in DNA polymerase affects accuracy of replication: bacteriophage T4, E. coli • Efficiency of DNA mismatch repair also under genetic control • Higher mutation rates may confer a selective advantage in a novel or changing environment
Fitness effects of mutations – 1 • Fig. 4.6a Effect of mutations on viability in 74 “mutation accumulation” lines of Caenorhabditis elegans
Fitness effects of mutations – 2 • Fig. 4.6b Effect of large random insertions on fitness in E. coli and yeast. The selection coefficient is the reduction in growth rate (fitness) of mutant cells relative to non-mutated controls
Fitness effects of mutations – summary • Most mutations are slightly deleterious or neutral • Few mutations are beneficial • New mutations will be heterozygous in diploids – therefore, recessive mutations (even good ones) will have no immediate phenotypic effect and will not be subjected to natural selection (while heterozygous)
Population size, mutation and natural selection • Larger populations will have more new mutant alleles of each gene in each generation • If humans, on average, have 1.6 new mutations per genome per generation and have 25,000 genes, then there will be 1 new mutant allele per gene per (25,000/1.6) ≈ 15,600 people in each generation (=100 new mutant alleles per gene per generation in a population of 1.56 million) • This calculation suggests that natural selection will be most effective at producing adaptive evolution in large populations because larger populations harbor more genetic variation, which is the “raw material” that underlies the phenotypic variation upon which natural selection acts.
Where “new” genes come from – gene duplication • Duplicate genes can be created by unequal crossing over • Duplicated genes can form “gene families” and “superfamilies” • Duplicate genes can: • Remain the same: 45s rRNA genes (increase “dosage”) • Differentiate, but continue to perform similar functions: globins (oxygen transport) • Perform unrelated functions: crystallins and their ancestors • Become “junk”: pseudogenes
Fig. 4.7 Unequal Cross-over and the origin of gene duplications
The globin superfamily in humans • The a-globin family • Chromosome 16 • contains (in order): z, yz, ya2, ya1, a2, a1, q • The b-globin family • chromosome 11 • contains (in order): e, Gg, Ag, yb1, d, b • Myoglobin • chromosome 22 • found in muscles • Globin – myoglobin duplication >800 Myr • Split between a- and b-globin families 450 – 500 Myr (a- and b-globin about 46% amino acid sequence similarity)
Fig. 4.8 Developmental expression members of globin gene family
Some Gene Families • Actins 5-30 • Myosin (heavy chain) 5-10 • Histones 100-1,000 • 45s rRNA (human) > 300 (5 chromosomes) • Keratins > 20 • Globins (a-like) 1-5 • Globins (b-like) ≥ 50
Characteristics of Inversions • Do not generally create new alleles (or genes) • “Suppress” crossing over when an inversion is heterozygous with a normal chromosome • i.e., recombination is prevented or reduced among the group of genes included within an inversion, so those genes act as a block or “supergene”, which may be adaptive • Occur in many, if not all, organisms, but are particularly well-known in Drosophila (D. pseudoobscura, D. subobscura)
Fig. 4.11 Inversion frequency clines in D. subobscura Frequency of the Est inversion South America North America South latitude North latitude
Polyploidy • Polyploid means having 3 or more complete haploid chromosome sets • e.g. Mendel’s peas were diploid and had 2n = 14 chromosomes (each haploid set had n = 7 chromosomes). A triploid pea would have 3n = 21 chromosomes, and a tetraploid pea would have 4n = 28 chromosomes • Polyploidy is common in higher plants, much rarer in animals • More than one-half of angiosperms are polyploid (relative to ancestors with fewer sets of chromosomes)
Fig. 4.12 Origin of tetraploidy in plants Cell-division error causes production of diploid gametes Parent 1st generation offspring Selfs, mates with 4n sibling, Or backcrosses to parent 2nd generation offspring
Frequency of Polyploidy • Some studies suggest that flowering plant species typically produce diploid gametes at a frequency of 0.00465 • The probability of two diploid gametes meeting to produce a zygote is, then, (0.00465)2 = 2.16 x10⁻⁵ (or about 2 out of every 100,000 offspring are tetraploid)
Importance of Polyploidy • Duplicates all genes, which may evolve new functions • A tetraploid, for example, is reproductively isolated from its diploid “parent” because the hybrid is triploid and sterile. Thus, the tetraploid is, in effect, a new species • Triploids have commercial significance because they are “seedless”
Ploidy in three species of Iris • Iris setosa has 2n = 36 chromosomes (n=18) • Iris virginica has 72 chromosomes (4n) • Iris versicolor has 108 chromosomes (6n) • I. Versicolor (common blue flag) may have been derived by hybridization between the other two species • Proportion of polyploid angiosperms is estimated to be from 30% (Stebbins 1950) to 50-70% (Stace 1989)
How much genetic variation is there? – 1 • Table 4.4 of your text gives the genotypes at the CCR5 gene in samples from various human populations (CCR5 protein is the co-receptor that HIV uses to enter host cells) • For example, the sample of 102 people from Iceland is as follows: Genotype +/+ +/D32 D32/D32 Number in sample 75 24 3
How much genetic variation is there? – 2 • Iceland sample (N = 102): Genotype +/+ +/D32 D32/D32 Number in sample 75 24 3 • The frequency of the + allele is: [(75 x 2) + 24] / (102 x 2) = 0.853 • The frequency of the D32 allele is: [(3 x 2) + 24] / (102 x 2) = 0.147 • The heterozygosity of this sample is: 24/102 = 0.235
How much genetic variation is there? – Variation in allele frequencies among populations Frequency of alcohol dehydrogenase (Adh)alleles in Australian fruit fly populations Geograpic pattern may result from greater stability of the AdhS allele at higher temperatures
How much genetic variation is there? – Heterozygosity • Heterozygosity is a commonly used measure of genetic variation for conventional genes, such as enzyme-coding loci • Heterozygosity increases with the number of alleles at a locus and is greatest when all alleles have the same frequency • 1 allele (a monomorphic locus): HHW = 0 • 2 alleles with frequencies 0.9 and 0.1: HHW = 2(0.9)(0.1) = 0.18 • 2 alleles with frequencies 0.5: HHW = 2(0.5)(0.5) = 0.50 • 4 alleles with frequencies 0.25: HHW = 1 - [4(0.25)2] = 0.75 • Where HHW is the expected heterozygosity when genotypes are in Hardy-Weinberg proportions
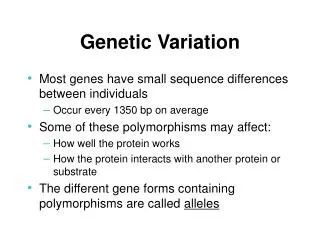
How much genetic variation is there? – 3 • Enzyme loci • 1/3 to 1/2 of genes are polymorphic in a typical population: that is they have 2 or more alleles with a frequency > 1% (or 5%) • a typical individual will be heterozygous at 4 – 15% of its loci • variation at enzyme loci is generally assayed by gel electrophoresis, which will detect only amino acid sequence differences in the gene products • We see even more variation when we look directly at nucleotide sequences of genes – synonymous substitutions, substitutions in non-translated regions
Fig. 4.17 Loss-of-function mutations in a sample of 30,000+ disease-causing alleles of the cystic fibrosis gene