Download
1 / 48
480 likes | 772 Views
Country Report BRAZIL. Fact Sheet. Area: Fifth largest country in the world and largest country in South America. total: 8,511,965 sq km land: 8,456,510 sq km water: 55,455 sq km Coastline: 7,491 km Climate: Mostly tropical, but temperate in south Population:

E N D
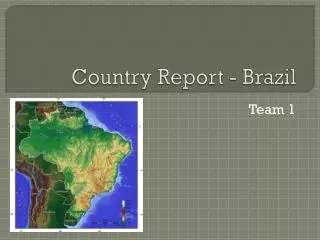
Country Report BRAZIL
Fact Sheet • Area: • Fifth largest country in the world and largest • country in South America. • total: 8,511,965 sq kmland: 8,456,510 sq kmwater: 55,455 sq km • Coastline: • 7,491 km • Climate: • Mostly tropical, but temperate in south • Population: • Most populous country in South America • 193.7 million (2009) • Age structure: • 0-14 years: 28.57% (male 25,390,039; • female 24,449,902)15-64 years: 65.98% (male 56,603,895; • female 58,507,289) • Location: • Eastern South America, bordering the • Atlantic Ocean. Shares common boundaries • with every South American country except • Chile and Ecuador
Fact File Country Name: Federative Republic of BrazilConventional short form: Brazil • Airports with paved runways • total: 570 • Railways • total: 30,539 km (2,129 km electrified); • excludes urban rail • Highways • total: 1.98 million km • GDP( US$bn) • 1,574.0 • GDP (per capita) • US$ 8,220 • GDP (PPP) as share % of world total • 2.87 • Capital • Brasilia • Administrative Divisions • Federal District (capital Brasilia), 26 • States and the 5,564 Municipalities • Independence • 7 September 1822 (from Portugal) • National Carrier • Varig • Languages • Portuguese (official), Spanish, English, • French
Travel and Tourism Competitiveness Index • Ranked 5th in the Americas and 45th overall • Ranked 2nd out of all countries for its natural resources and 14th for its cultural resources • Ground transport remains underdeveloped with the quality of roads, ports and railroads ranked 110th,123rd and 86th respectively • Safety and security (ranked 130th), overall policy environment (95th) and lack of price competitiveness (ranked 91st) are causes of concern Source: The Travel & Tourism Competitiveness Report, 2009
Outbound Tourism - Determinants The future determinants of the frequency and volume of outbound travel are: • The total population – or potential market size • Per Capita GDP • The degree of internet usage
South America Outbound - Determinants Population, Per Capita GDP, Internet Usage, 2008 Country Gross Domestic Product ** Internet Users Population (million) Total Per Capita Number Population ($ billion) ($) (’000) penetration Argentina 40.677 523.7 13,300 16,000 39.7% Bolivia 9.248 39.4 4,000 580 6.4% Brazil 191.809 1,836.0 9,700 42,600 22.4% Chile 16.454 231.1 13,900 7,035 43.2% Colombia 45.014 319.5 6,700 10,097 22.8% Ecuador 13.928 98.8 7,200 1,549 11.3% Falklands Islands* 0.003 0.075 25,200 2 69.4% French Guiana 0.209 3.5 17,300 42 20.5% Guyana 0.771 2.9 3,800 160 20.8% Paraguay 6.348 27.1 4,500 260 3.9% Peru 27.926 219.0 7,800 7,324 25.5% Suriname 0.438 4.1 7,800 32 6.8% Uruguay 3.478 37.2 11,600 1,100 31.8% Venezuela 26.415 334.6 12,200 5,298 20.4% Total 382.326 3,677.7 n.a. 92,079 24.2% * claimed by Argentina, including South Georgia and South Sandwich Islands ** in terms of purchasing power parity (PPP) Sources: US Census Bureau, CIA World Factbook, Internet World Stats
South America Outbound - Regions • Intra-regional travel tops • The main destinations for outbound travellers from South America have traditionally been Central/South America, Europe and the United States
Brazil Leads Country 2002 2003 2004 2005 2006 % Change 2002-06 Argentina 3,008 3,008 3,904 3,894 4,009 33.3% Bolivia 217 305 331 312 n.a. n.a. Brazil 2,338 3,225 3,701 4,667 4,625 106.4% Chile 1,938 2,100 2,343 2,651 n.a. n.a. Colombia 1,277 1,177 1,405 1,553 n.a. n.a. Ecuador 627 613 603 664 733 16.9% Paraguay 141 153 170 188 210 48.9% Peru 1,232 1,392 1,635 1,841 1,857 50.7% Uruguay 530 495 569 658 666 25.7% Venezuela 881 832 816 1,067 1,095 24.3% Total 12,189 13,300 15,477 17,495 n.a. n.a. * data not available for Falklands Islands, French Guiana, Guyana and Suriname Source: UNWTO and country data
Population vs Economy • Around 80% of Brazilians reside in urban centres • The south-east region is the richest and most densely populated and has the country's two largest cities, São Paulo and Rio de Janeiro, while the south is the wealthiest in terms of GDP per capita.
Largest Metropolitan Regions In population terms (2006), the largest metropolitan regions are São Paulo (19.95 mn) Rio de Janeiro (11.35 mn) Belo Horizonte (5.4 mn) Porto Alegre (4.1 mn) Recife (3.65 mn)
Largest Cities Based on the population of the municipality where the city is located rather than its metropolitan region: São Paulo (10.9 mn) Rio (6.1 mn) Salvador (2.9 mn) Fortaleza (2.4 mn) Brasilia (2.5 mn) Belo Horizonte (2.4 mn)
Economic Indicators Economic Indicators (2007 estimates) Ninth largest economy in the world GDP (purchasing power parity): $1.836 trillion GDP (official exchange rate): $1.314 trillion GDP – real growth rate: 5.4% GDP – per capita (PPP): $9,700 GDP composition by sector: agriculture: 5.5%; industry: 28.7%; services: 65.8% Labour Force: 99.5million Labour Force by occupation (2003 est.): agriculture: 20%; industry: 14%; services: 66% Unemployment rate: 9.3% Population below poverty line (2005 est.): 31% Inflation rate (consumer prices): 4.5% annual average One of the four emerging economies – Brazil, Russia, India and China (BRIC)
Economy and Tourism Expenditure Share of tourism expenditure in 2008 Unit 2004 2005 2006 2007 Gross Domestic Product (GDP) Percent 0.5 0,5 0.4 0.4 0.4 Exports of goods Percent 3.5 3.5 3.3 3.3 3.1 Exports of services Percent 26.9 26.0 23.5 22.1 20.1
Exchange Rates against Major Currencies, 2003-08 (reals per currency)* Currency 2003 2004 2005 2006 2007 2008 % Change (2003-08) US Dollar 3.08 2.93 2.43 2.18 1.85 1.59 - 48.4% Euro 3.34 3.75 2.84 2.85 2.58 2.54 - 24.0% UK Pound 4.81 5.63 4.13 4.13 3.81 3.17 - 34.1% * mid-year rates Source: OANDA.com
Online Environment • 75,943, 600 internet users in Brazil (representing 37.8% of the population) • in June 2010. • This was up by 1,418.9% compared to 2000. • While the population penetration rate is • relatively low, Brazil still has the most • internet users in Latin America. • Brazil has the third largest number of • broadband lines in the Americas • 40% of Brazilian adults use the • internet from home • 30% from a public access location • Source: newmediatrendwatch.com
Outbound:Market Size and Characteristics • In 2006 only 3.9% of Brazilians had taken a trip abroad, compared with 36.9% who had travelled within the country • Brazilians are more inclined to take holidays within Brazil, rather than abroad
Outbound: Departures Outbound Departures from Brazil, 2002-06 2002 2003 2004 2005 2006 % Change (’000) (’000) (’000) (’000) (’000) 2002-06 Total Departures 2,338 3,225 3,701 4,667 4,825 106.4% % change -11.6% 37.9% 14.8% 26.1% 3.4% (annual) Source: UNWTO and EMBRATUR
Outbound - Major Regions • Regionally, Europe is the most popular destination for Brazilian outbound travellers, attracting some 41% of the total in 2005, compared to Central/South America (30%) and North America (20%). • Brazil, the largest source market in South America for US, is expected to increase 35 percent in 2010 and produce a record 1.2 million visitors. By 2015 the United States could host a record 2.7 million Brazilian visitors, a 198% increase over 2009.
Outbound - Major Destinations Arrivals of Brazilian Tourists in Main Destinations, 2002-06 Destination 2002 2003 2004 2005 2006 % Change (’000) ’000) (’000) (’000) (’000) 2002-06 Argentina 345 350 419 453 559 62.0 United States 405 349 385 485 525 29.6 Spain 146 97 184 222 269 84.2 Uruguay 118 151 188 198 228 93.2 Italy 114 86 129 182 219 92.1 Portugal 112 118 132 159 204 82.1 Chile 79 100 119 167 179 126.6 Germany 72 70 83 94 156 116.7 United Kingdom 83 70 78 91 112 34.9 Paraguay 43 41 49 56 98 127.9 Source: Brazil Report, Tourism Intelligence International
Outbound - Intra Region Of the top ten destinations visited by Brazilians in 2006, four are in South America: Argentina (559,000) Uruguay (228,000) Chile ( 179,000) Paraguay ( 98,000)
Outbound - Major Destinations Argentina is the most popular country for Brazilians followed by United States Spain leads Europe as the Brazilian destination of choice. Other destinations in Europe are Italy, Portugal and Germany( in each case there are close family ties with Brazil), the United Kingdom (popular with Brazilians wishing to study English) Source: Brazil Report, Tourism Intelligence International
Outbound - Aspirational Destinations Destinations where Brazilians would wish to make a leisure visit: Italy, France, Spain, Greece, Portugal, Switzerland, Canada, Australia, Germany and Sweden. Source: Brazil Report, Tourism Intelligence International
Annual Holidays and Leave • Employees have an average of four weeks annual leave. • In addition, there are 12 public holidays during the year.
Outbound - Expenditure Tourism expenditures outpace tourism receipts Units 2004 2005 2006 2007 2008 Departures (‘000) 3,701 4,667 4,625 4,823 4,936 Tourism US$Mn 3,752 5,905 7,501 10,434 13,269 Expenditure
Outbound - Source Markets Main sources of Brazilian outbound travel • São Paulo • Rio de Janeiro
Outbound - Purpose of Visit • Leisure is the main reason for Brazilians travelling overseas • In 2005, almost two thirds (63%) of Brazilian outbound travel was for leisure purposes, compared with one third (33%) for business and 4% for VFR purposes. • For visits to the United States, vacation/holiday trips accounted for 49% of the total in 2005; business, 36%; VFR, 24%; and conventions, 14% (Source: OTTI) • For visits to the UK, the average shares for 2006 were 40% for holidays; 18% for business; 23% for VFR; 14% for study; and 5% for other purposes. (Source: IPS) • Portugal, Spain and Germany have higher than average proportions of VFR visits (Source: ETC)
Outbound - Demographic Profile Majority of Brazilian travellers are middle-aged • In 2002, just under half (48.4%) of all Brazilian outbound travellers were in the 28-45 age group, compared with 28.9% aged 46-65, 19.4% aged 18-27; and 3.3% aged 66 and over. • In the case of travel to Britain, in 2006, over half (53%) of visitors from Brazil were aged between 25- 44 (of which 32% were in the 25-34 age group). The majority of Brazilian visitors to the US fall into the 35-54 year old age bracket. Source: Brazil Report, Tourism Intelligence International
Outbound - Seasonality • Most Brazilian visits to Europe take place from June to August coinciding with the winter season in Brazil. • In 2006, 30% of Brazilian visits to Britain were in the period July-September; 29% in January-March; and around 20% each in the remaining parts of the year, April-June and October-December (Source: IPS) • For visits to the United States, July, December and January are the most popular months (Source: OTTI)
Outbound - Travel Motives • Fashionable, vibrant cities such as New York, Miami, London, Paris etc. • Ski resorts in Argentina and Chile. • Cheaper shopping options in Paraguay and other neighbouring South American countries. • Visit relatives in European countries. Many Brazilians are first- and second generation descendants of European settlers, and as such, cultural and historical links between Brazil and Europe remain strong. • To immerse themselves in Europe’s diverse culture and heritage. • To attend prestigious sporting occasions (football, Formula 1 motor racing, etc). • Business, trade, official trips • Study, education (especially in Europe and North America)
Outbound - Travel Group • Brazilian visitors are more likely to be travelling either alone (49%) or with other adults in a tour group (27%), and only 4% in a traditional family group of spouse/partner and children. • Most Brazilian visitors to the United States are married and more inclined (40%) to take their children with them. Source: Brazil Report, Tourism Intelligence International
Outbound - Air Travel • In 2007, over 6 million passengers were carried on outbound international flights - a 64% increase over 1995 - of which 38% were to European destinations; 37% to South/Central America; 23% to North America; and the remaining 2% to Africa and Asia. (Source: INFRAERO) • Growth of air traffic in Brazil in the last few years, especially in its south-east region, has put severe pressure on airport infrastructure. • Non-stop flights from Brazil to international destinations are insufficient.
Outbound - International Gateways The main international gateways are : • Aeroporto Internacional de Guarulhos in São Paulo connects to 28 countries • Aeroporto Internacional do Galeão in Rio de Janeiro connects to 18 countries • Nearly all commercial airports are operated by INFRAERO, a government agency.
Outbound - Behaviour Pattern • Brazilians are widely regarded as racially tolerant, friendly, fun-loving, and strongly attracted to city life. • If Portuguese translations are not available, Brazilians prefer to be given information in English, rather than Spanish. • Accommodation in 3 and 4 star hotels in city centre locations. The wealthier travellers prefer 5 star luxury hotels. Serviced apartments and B&Bs are increasingly chosen by families. Source: Brazil Report, Tourism Intelligence International
Outbound: Activities Preferred • Shopping for fashion items is one of the prime activities. South American destinations are favoured by the more budget-conscious shopper. • Visits to historical places, art galleries and museums, and sightseeing in cities, visits to cultural heritage sites, amusement/theme parks. • There is growing interest in Caribbean destinations. • Winter sports (particularly in Argentina, Chile, North America and Europe). • Nightlife and culture: Brazilians enjoy going out to cafes, bars and clubs whilst visiting a foreign country. They are also interested going to the theatre, opera, ballet, etc.
Outbound - Planning • Internet is the key planning tool for international travel. • One to three months is usually required for deciding on an international trip and some may take more than three months. • Independent travel is popular in Brazil
Outbound - Press Influence • There is no national press, but the major newspapers in São Paulo and Rio de Janeiro reach wide audiences. They are: Globo (Rio daily), Jornal do Brasil (Rio daily), Folha de São Paulo (daily),Estado de São Paulo (daily) and Correio Braziliense. Most newspapers publish a weekly travel supplement. • The most important magazines for reaching potential travellers are the weekly Veja, Exame and Caras and the monthly travel magazines Revista Viagem e Turismo and Próximo Viagem. The main travel trade publications are Panrotas and Brasilturis.
Outbound - Media Influence • Radio is still a popular form of entertainment and news reporting. The main stations are Radio Nacional, Globo Radio; Radio Eldorado Radio Bandeirantes and Radio Cultura • The main TV channels are TV Band , Rede Globo,Sistema Brasileiro de Televisao,TV Record, NBR, Rede TV,TV Cultura • Cable TV is well established in the major urban areas.
Outbound - Forecast • The Brazilian outbound travel market is anticipated to remain relatively buoyant in the short to medium term. • Assuming that the Brazilian currency, Real remains strong and the Brazilian economy continues to expand at a moderate pace, the number of outbound trips will increase to around 6.5 million by 2011, and to grow by 4.5% on average, year to year, to over 8 million by 2020, a rise of about two thirds on 2006. • Both Argentina and the United States are likely to remain the top destinations for Brazilian outbound travel, boosted in the one case by the continuing weakness of the peso, and in the other by the appreciation of the real against the US Dollar. • Trips to other destinations, such as Chile, Uruguay and Paraguay (which are now considered as relatively inexpensive) are also expected to grow, as will travel to Europe (assuming there is sufficient airlift capacity). Source: Brazil Report, Tourism Intelligence International
Marketing Tips • Initially, it is best to target the two main potential market areas: Sao Paulo and Rio de Janeiro • Brochures and information in Portuguese are much appreciated by the local trade • The holiday periods of December /January /February and July should be avoided. Carnival and Easter are also bad times to visit Source: Brazil Report, Tourism Intelligence International
Inbound - Arrivals 2004 2005 2006 2007 2008 (‘000) (‘000) (‘000) (‘000) (‘000) Overnight Visitors 4,794 5,358 5,017 5,026 5,050 Arrivals By Region Africa 65 76 84 75 76 Americas 2,703 2,998 2,717 2,779 2,884 Europe 1,860 2,097 1,980 1,938 1,814 East Asia & the Pacific 156 177 217 206 256 South Asia - - - - 19 Middle East 6 7 18 26 - Source: UNWTO Brazil Factbook
Inbound - Source Regions, 2008 • The largest source market for Brazil inbound is the Americas(2,883,839). South America contributed the highest (2,070,391) in this region indicating that intra regional travel is quite high. • Europe(1,814,146) is the second largest source market with the highest contribution from Southern Europe(701,274) comprising Greece, Italy, Portugal, Spain. • Country wise , the top five source markets, 2008 are: Argentina(871,147), United States of America(769,232), Uruguay(300,791),Chile(261,080), Italy(252,193).
Inbound - Mode Of Travel 2004 2005 2006 2007 2008 (‘000) (‘000) (‘000) (‘000) (‘000) Air 3569 3938 3713 3747 3691 Rail - - - - - Road 1151 1314 1181 1150 1249 Sea 74 106 123 129 110 Source: Brazil Fact book, UNWTO
Inbound - Purpose Of Visit 2004 2005 2006 2007 2008 (’000) (‘000) (‘000) (‘000) (‘000) Leisure, Recreation & Holidays 2325 2379 2213 2221 2187 Business & Professional 1376 1559 1410 1437 1222 Other 1093 1420 1314 1367 1641 Source: Brazil Fact book, UNWTO
Inbound - Tourism Expenditure 2004 2005 2006 2007 2008 Total ( in US$ Mn) 3389 4168 4577 5284 6109 Travel ( in US$ Mn) 3222 3861 4316 4953 5785 Passenger Transport ( in US$ Mn) 167 307 261 331 324 Source: Brazil Fact book, UNWTO
Major Travel and Tourism Events • ABAV, Fair of the Americas : held in Rio de Janeiro in October that annually attracts more than 700 exhibitors from 40 countries and some 25,000 trade professionals. Considered the major event of the Latin American travel and tourism industry focused on the trade. • Salão do Turismo: held in São Paulo in June, a gathering of travel-related organisations promoted by the Brazilian Ministry of Tourism. The event is open to travel-industry professionals and the general public. • EQUIPOTEL : held in São Paulo in September, international fair of equipment, products and services for the hotel and hospitality industry.
Useful Links • www.embratur.gov.br • www.abav.com.br • http://salaodoturismo.com.br
References • UNWTO • European Travel Commission Reports • Tourism Industry Intelligence – Brazil Report • EMBRATUR • OTTI • Visit Britain Country Profiles • Internet World Stats • CIA - The World Factbook 2001 • Anholt-GMI Brands Index/British Tourist Authority
Disclaimer The report is based on the information from the published sources and references mentioned and inferences drawn are from them. Stark Tourism Associates and its parent organization, The Stark Group and the Group Companies - Stark Communications, Stark Expo, Stark World Publications are not responsible for errors/omissions that could have crept in knowingly or unwittingly.