
Cellular FRET Visualization via Spectral Mode Imaging
Visualization of intracellular FRET using spectral mode imaging to detect pDNA localization in extra-nuclear regions and nucleus. The study shows pDNA existence and distribution within the cell.

Cellular FRET Visualization via Spectral Mode Imaging
E N D
Presentation Transcript
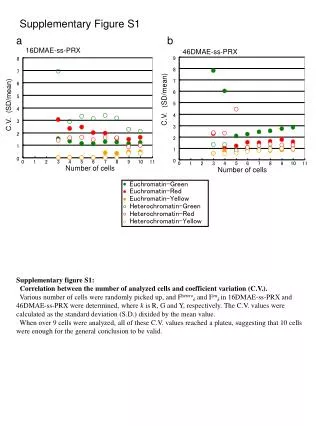
46DMAE-ss-PRX 9 8 7 6 5 4 3 2 1 0 0 1 2 3 4 5 6 7 8 9 10 11 Number of cells Supplementary Figure S1 a b 16DMAE-ss-PRX 8 7 6 5 C.V.(SD/mean) C.V.(SD/mean) 4 3 2 1 0 0 1 2 3 4 5 6 7 8 9 10 11 Number of cells Euchromatin-Green Euchromatin-Red Euchromatin-Yellow Heterochromatin-Green Heterochromatin-Red Heterochromatin-Yellow Supplementary figure S1: Correlation between the number of analyzed cells and coefficient variation (C.V.). Various number of cells were randomly picked up, and Fheterok and Feukin 16DMAE-ss-PRX and 46DMAE-ss-PRX were determined, where k is R, G and Y, respectively. The C.V. values were calculated as the standard deviation (S.D.) dixided by the mean value. When over 9 cells were analyzed, all of these C.V. values reached a plateu, suggesting that 10 cells were enough for the general conclusion to be valid.
Supplementary Figure S2 a b 1 M 2 3 M 5 4 8 6 7 -EtBr + EtBr Supplementary figure S2 QD and pDNA was visualized by UV-irradiation before (a) and after (b) the staining with ErBr. M: size marker; lane 1 and 5: native pDNA ; lane 2 and 6: QD only; lane 3 and 7: mixture of QD and biotin-unlabeled pDNA (before purification); lane 4 and 8: mixture of QD and biotin-unlabeled pDNA (after purfication by Sephadex G50 spin column). Native pDNA (lane 5) proceeded more than free QD (lane 2 and lane 6). The QD (lane 3) was observed at diffferent position from pDNA (lane 7) when QD was mixed with biotin-unlabeled pDNA. Furthermore, the unlabeled QD was completely removed (lane 4) when the mixture was passed through the Sephadex G50 column. These data and Figure 2 collectively show that QD was labeled on pDNA via biotin-avidin interaction. Moreover, Sephadex G50 column can separate free QD completely from the mixure of QD and pDNA.
Supplementary Figure S3 Supplementary figure S3: Visualization of intracellular FRET For capturing the images by spectral mode (λ mode), the QD was similarly excited by light (488nm) from an argon laser. The emitted light ranging from 537 nm to 569 nm, and more than 630 nm was simultaneously corrected by META equipment for the QD-and rhodamine-derived signals. These data were digitally exhibited in green (G) and red (R) channels, respectively. Thereafter, the Hoechst33342 signals excited by a 2-photon Maitai laser (780 nm) were captured, and digitally exhibited in blue (B) channel. The pDNA detected in the cytoplasmic region (extra-nuclear regions) are mainly detected as red clusters (indicated as red arrowhead), while the pDNA in the nucleus were detected as green in the nuclus (indicated as green arrowhead). Thus, pDNA exists as condensed form in cytoplasm presumably because of the protection by lipid envelope.