Download
1 / 145
1.45k likes | 1.66k Views
Infant nutrient needs. Basis Approach Specific nutrients water energy protein fatty acids vitamin K Vitamin D Iron Fluoride. Basis of recommendations. Growth and development Preventing deficiencies Meeting nutrient requirements Physiology GI Renal Programming

E N D
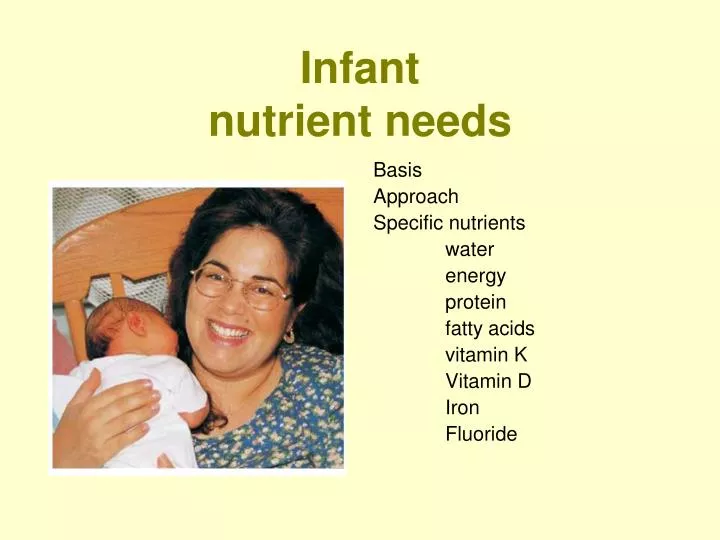
Infantnutrient needs Basis Approach Specific nutrients water energy protein fatty acids vitamin K Vitamin D Iron Fluoride
Basis of recommendations • Growth and development • Preventing deficiencies • Meeting nutrient requirements • Physiology • GI • Renal • Programming • Preventing chronic conditions • Optimizing health through lifecycle
Goals and Objectives • Optimal growth and development • Safety • Individual health • Population Health • Prevention and Chronic Illness
Challenges • Strength of Evidence • Individual vs. population • Public health approach • Individual genetics • Maternal-infant dyad • In utero endowment • Beliefs, values, choices • Relationship/nurture • Environmental factors
1940’s • Rickets (D) • Pellagra (Niacin) • Scurvy (C) • Beriberi (Thiamin) • Xeropthalmia (A) • Goiter (Iodine)
United Nations 5th report on World Nutrition: March 2004 • Vitamin A deficiency • 140 million preschoolers • 7 million pregnant women • Iron Deficiency • One of most prevalent • 4-5 billion affected
Causes Nutrition - Disease Access Food Health Care Environment Economics Education
At Birth • Gut of the newborn is faced with the formidable task of passing, digesting, and absorbing large quantities of intermittent boluses of milk • Comparable feeds per body weight for adults would be 15 to 20 L • Enzymes for digestion of macronutrients
Limited ability to concentrate urine in first year due to immaturities of nephron and pituitary Potential Renal solute load determined by nitrogenous end products of protein metabolism, sodium, potassium, phosphorus, and chloride. Renal
Nutrient composition in early diet may have long term effects on GI function and metabolism Animal models show that glucose and amino acid transport activities are programmed by composition of early diet Animals weaned onto high CHO diet have higher rates of glucose absorption as adults compared to those weaned on high protein diet Barker Hypothesis: Association between BMI and chronic disease: HTN and cardiovascular, SGA/IUGR Programming by Early Diet
Nutrients • Guidelines • Recommendations • Education
Individual Requirements • Genetics • Adaptation • Environment • Behavior/activity • Choices, access, resources • other
Approaches to Estimating Nutrient Requirements • Direct experimental evidence (ie protein and amino acids) • Extrapolation from experimental evidence relating to human subjects of other age groups or animal models • ie thiamin--related to energy intake .3-.5 mg/1000 kcal • Breast milk as gold standard (average [] X usual intake) • Metabolic balance studies (ie protein, minerals) • Clinical Observation (eg: manufacturing errors B6, Cl) • Factorial approach • Population studies
Recommendations/guidelines • DRI: Dietary Reference Intakes • AI • UL • EER • AAP • Bright Futures • Start Healthy feeding guidelines
DRI: Dietary Reference Intakes periodically revised recommendations (or guidelines) of the National Academy of Sciences quantitative estimates of nutrient intakes for planning and assessing diets for healthy people AI: Adequate Intake UL: Tolerable Upper Intake Level EER: Estimated Energy Requirement
DRI’s for infants • Macronutrients based on average intake of breast milk • Protein less than earlier RDA • AAP Recommendations • Vitamin D: 200 IU supplement for breastfed infants and infants taking <500 cc infant formula • Iron: Iron fortified formula (4-12 mg/L), Breastfed Infants supplemented 1mg/kg/d by 4-6 months
Water • Water requirement is determined by: • water loss • evaporation through the skin and respiratory tract (insensible water loss) • perspiration when the environmental temperature is elevated • elimination in urine and feces. • water required for growth • solutes derived from the diet
Water • Water lost by evaporation in infancy and early childhood accounts for more than 60% of that needed to maintain homeostasis, as compared to 40% to 50% later in life • NAS recommends 1.5 ml water per kcal in infancy.
Water • Individual needs • Renal concentrating ability • Solute in diet • Health • environment
Water • Water balance • RSL in diet • Water in • Water out • Renal concentrating ability
Renal solute load • Samuel Foman J Pediatrics Jan 1999 134 # 1 (11-14) • RSL is important consideration in maintaining water balance: • In acute febrile illness • Feeding energy dense formulas • Altered renal concentrating ability • Limited fluid intake
Water vs fluid • Concentrating formula decreases free water and increases RSL • What is the % water in 20 kcal/oz infant formula? • 90% • To achieve 100 ml/kg/d needs to consume at least 110 cc/kg/d
Energy Requirements • Higher than at any other time per unit of body weight • Highest in first month and then declines • High variability - SD in first months is about 15 kcal/kg/d • Breastfed infants many have slighly lower energy needs • RDA represents average for each half of first year
Energy Requirements, cont. • RDA represents additional 5% over actual needs and is likely to be above what most infants need. • Energy expended for growth declines from approximately 32.8% of intake during the first 4 months to 7.4% of intake from 4 to 12 months
EER • 0-3 months (89 x wt -100) + 175 • 4-6 months (89 x wt -100) + 56 • 7-12 months (89 x wt -100) + 22 • 13-35 months (89 x wt -100) + 20 • Equations for older children factor in weight, height and physical activity level (PAL)
Protein • Increases in body protein are estimated to average about 3.5 g/day for the first 4 months, and 3.1 g/day for the next 8 months. • The body content of protein increases from about 11.0% to 15.0% over the first year
Essential Fatty Acids • The American Academy of Pediatrics and the Food and Drug Administration specify that infant formula should contain at least 300 mg of linoleate per 100 kilocalories or 2.7% of total kilocalories as linoleate.
Essential Fatty Acids • The American Academy of Pediatrics and the Food and Drug Administration specify that infant formula should contain at least 300 mg of linoleate per 100 kilocalories or 2.7% of total kilocalories as linoleate.
LCPUFA DHA and ARA
LCPUFA: Background • Ability to synthesize 20 C FA from 18 C FA is limited. • n-3 and n-6 fatty acids compete for enzymes required for elongation and desaturation • Human milk reflects maternal diet, provides AA, EPA and DHA • n-3 important for neurodevelopment, high levels of DHA in neurological tissues • n-6 associated with growth & skin integrity
Formula supplementation with long-chain polyunsaturated fatty acids: are there developmental benefits? Scott et al. Pediatrics, Nov. 1998. • RCT, 274 healthy full term infants • Three groups: • standard formula • standard formula with DHA (from fish oil) • formula with DHA and AA (from egg) • Comparison group of BF
Outcomes at 12 and 14 months • No significant differences in Bayley, Mental or Psychomotor Development Index • Differences in vocabulary comprehension across all categories and between formula groups for vocabulary production.
MacArthur Communicative Development Inventories at 14 Months of Age
Conclusion “We believe that additional research should be undertaken before the introduction of these supplements into standard infant formulas.”