Download
1 / 25
250 likes | 417 Views
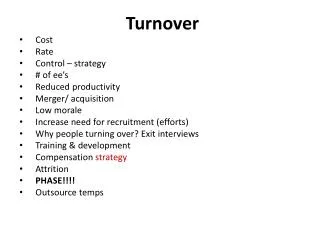
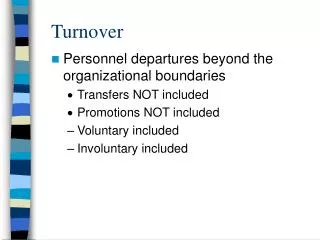
FREE-RIDERS and TURNOVER. Jun Kobayashi (Chicago) Naoko Taniguchi (Teikyo, Michigan) Hirokuni Ooura (Teikyo) August 18, 2004 ASA Mini Conference, SF. OVERVIEW. Free-riders and Turnover “Free-riding and Mobility” Project Survey on Japanese White-collar workers, N =810

E N D
FREE-RIDERS andTURNOVER Jun Kobayashi (Chicago) Naoko Taniguchi (Teikyo, Michigan) Hirokuni Ooura (Teikyo) August 18, 2004 ASA Mini Conference, SF
OVERVIEW • Free-riders and Turnover • “Free-riding and Mobility” Project • Survey on Japanese White-collar workers, N=810 • Free-riders and Cooperators in Job Change, Income, Satisfaction
QUESTION • Effects of FREE-RIDING on of JOB CHANGE??? • FR=“Less Efforts than Expected” • Cooperator=“Provide Enough Efforts” • No Free-riders Assumed • Mutual Cooperation, Monitoring
LITERATURE • Empirical Studies on FR (’92-): No “Job Change” variable • Takahashi (1997): Motivated -> LOW Willingness • Cooperators -> Job Change↓??? • We Challenge this Prediction
HYPOTHESES • Rational to “Free-ride” and “STAY” • Koyama + Ooura + Kobayashi: Cooperators can gain by “EXITING” • H1 Cooperators CHANGE Jobs More • H2 More WILLING to Change Jobs • H3 EARN More • H4 More SATISFIED
JAPANESE WORKERS • 67M Workers (130M) • 41% Females • 84% Employed • Blue 38%, White 49, Service 11 • Primary 5%, 2nd 30, Tertiary 65 Focus
Introduction Data Result
SURVEY • “Job Change and Work Attitudes” • March 2004, in Japan • White-collar, Full-time workers • Males, Age 30-49 • N=810 • Self-report, 74 questions, 5 points
SAMPLING • On Internet, Marketing company • (1) Registered 14,000 • -> (2) 1,600 Randomly • -> (3) First 810 • Receive 250 yens ($2)
DEPENDENT VARIABLES • Job Change Experience/Willingness • Binary Logistic Regressions • Covariance Structure Analyses • INCOME Increase, SATISFACTION • Compare Current and Previous Jobs • “5 years ago” if NO Change
INDEPENDENT VARIABLES • Latent Variables from 5 Point-scales • “FREE-RIDING” (α=.51) • Do Less than Fair Share • Save Efforts if Others Work Hard • Not Educate Juniors • “PUNITIVE” (α=.53) • Hate Betrayers • “Eye for Eye” is Reasonable • Try to Exclude Lazy Coworkers
CONTROL VARIABLES • “MOTIVATION” (α=.68) • Try to Improve Skills • Confident in Ability • Long-term Work Plans • “COMMITMENT” (α=.66) • Loyalty to Organization • Solidarity with Coworkers • Group Benefits over Personal
Introduction Data Result
JOB CHANGE N=810 (41.1%) (61.5%)
FREE-RIDING, PUNITIVE N=810 Skewness=.184 = -.408
y = JOB CHANGE Binary Logistic Regression (N=810)
COVARIANCE STRUCTURE College Free-rider Income - - - Punitive + Job Change S: Evaluation + + - Motivation S: Income - - S: Future GFI=.670 AIC=19,813 N=769 Commit S: Manager
y = WILLINGNESS Binary Logistic Regression (N=810)
COVARIANCE STRUCTURE Job Change Free-rider - + Work Years - Punitive +† Willingness + - Motivation - - S: Evaluation GFI=.604 AIC=4,837 N=769 Commit S: Promotion
INCOME INCREASE • Among those who MOVED • Those who STAYED • NO Significant Difference > >
SATISFACTION • Those who MOVED • Those who STAYED • Difference among those who Stayed > ** >
SUMMARY • Free-riding and Job Change • Cooperative workers MOVE more • Punitive workers WANT to MOVE • Cooperators increase INCOME and SATISFACTION than Free-riders
THE BIG PICTURE • Org. Equilibrium Theory... • Participation and Contribution • If Rational to EXIT, Why STAY? • WHO Free-rides? • Compare w/ Simulation, Experiment, Organizational Survey