Download
1 / 1
10 likes | 171 Views
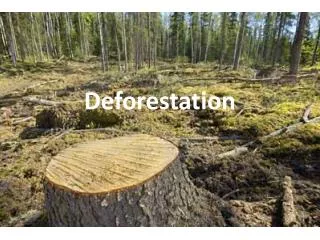
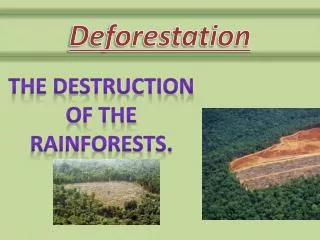
Not-deforested. Detections. Deforested regions. b. a. c. Multi-channel filter to de-speckle. Multi-channel filter to de-speckle. Normalise intensities to forest reference. Normalise intensities to forest reference. Co-register. Co-register. Acquire time series.

E N D
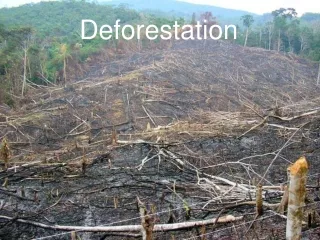
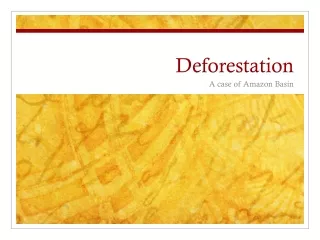
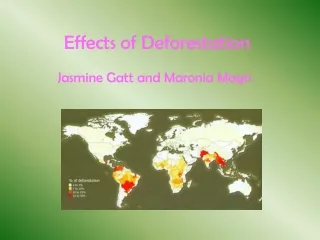
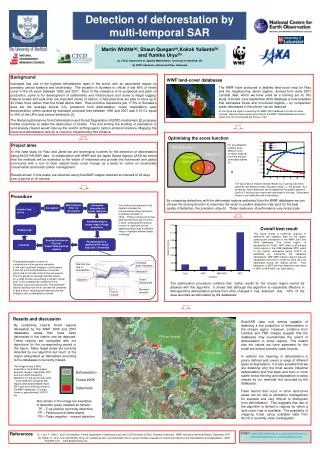
Not-deforested Detections Deforested regions b a c Multi-channel filter to de-speckle Multi-channel filter to de-speckle Normalise intensities to forest reference Normalise intensities to forest reference Co-register Co-register Acquire time series Acquire time series Variability map to create mask of high deviations Variability map to create mask of high deviations Display map Display map Scoring function to filter out known false positive regions Scoring function to filter out known false positive regions Parameterization applied within mask step size > threshold Parameterisation applied within mask step size > threshold Linearise Linearise FP(not-forest) FP(forest) Deforestation Forest 2008 TP Detections FN Detection of deforestation by multi-temporal SAR Martin Whittle(a), Shaun Quegan(a),Kokok Yulianto(b) and Yumiko Uryu(b) (a) CTCD, Department of Applied Mathematics, University of Sheffield, UK. (b) WWF Indonesia, Jakarta and Riau, Indonesia. Background Indonesia has one of the highest deforestation rates in the world, with an associated impact on planetary carbon balance and biodiversity. The situation in Sumatra is critical: it lost 65% of forest cover in the 25 years between 1982 and 2007. Most of the clearance is for pulpwood and palm oil production, some is for development of settlements and infrastructure and some is illegal logging. Natural forests and peat soils are important stores of carbon, in fact peat soils are able to store up to 30 times more carbon than the forest above them. Riau province represents just 17.5% of Sumatra’s area but the average annual CO2 emissions from deforestation, forest degradation, peat decomposition (often caused by drainage) and peat fires between 1990 and 2007 was 0.19 Gt, equal to 34% of the UK’s total annual emissions [1]. The Reducing Emissions from Deforestation and Forest Degradation (REDD) mechanism [2] proposes market incentives to abate the destruction of forests. This and limiting the building of plantations to land already cleared would improve the world’s anthropogenic carbon emission balance. Mapping the forest and deforestation activity is crucial to implementing this initiative. WWF land-cover databases The WWF have produced a detailed land-cover map for Riau and the neighbouring Jambi regions, derived from early 2007 Landsat data, which we have used as a training set for this study. A limited June-September 2008 database is now available that delineates forest and non-forest regions – by comparison areas deforested in the interim can be deduced. In this figure the region covered by the WWF 2007 database is shown as white outlines. Natural forest regions according to the WWF 2008 database are shown green and non-forest areas are shown in red. Optimising the score function Project aims In this case study for Riau and Jambi we are developing routines for the detection of deforestation using ALOS PALSAR data. In collaboration with WWF and the Japan Space Agency JAXA we intend that the methods will be extended to the whole of Indonesia and provide the Indonesian and global community with a tool to track natural forest cover change as a basis for action on biodiversity conservation and forest carbon management. Results shown in this poster are obtained using ScanSAR images obtained at intervals of 46 days over a period of 18 months. For any detection scheme some detections are correctly made (a) but there are also some false alarms (b). A The figure above shows example results for a scoring rule which specifies that detections with relaxation times < tr are ignored. As tr increases, fewer detections are accepted but the quality improves. Each of 5 scoring-rules have been optimised in this way. Some were shown to be ineffective and unnecessary. Procedure By comparing detections with the deforested regions estimated from the WWF databases we can choose the scoring function to maximise the recall or positive detection rate (a/c) for the best quality of detection, the precision, a/(a+b). These measures of performance vary reciprocally. The method summarised in this diagram includes the pre-processing steps necessary to prepare the data for fitting. Fitting a whole scene may take several hours but once this is done, computing the scoring function is rapid and can be applied several times in different ways to highlight different types of change. Overall best result This figure shows a numerical analysis of detections per category area for the region covering the intersection of the WWF 2007 and 2008 databases. The whole region, is represented as “Total”, MPF refers to all primary forest regions in the 2008 database, MDF refers to the regions deforested during 2007-8 as estimated by comparing the database delineations, MNF-MDF refers to regions that are designated not-forest in 2008 but were also not deforested during the interval period. Thus detections in MDF are true detections and those in MPF or MNF-MDF are false alarms. The parameterisation routine fits a sloping line to the rise and relaxation of the most significant change in a time-series. It also fits a horizontal baseline to the initial points and to the final points if they are present. The fit is applied to average intensity values for a small window surrounding a chosen central pixel. In this example the variations of the individual pixels are also shown. The parameter values resulting from the fit can then be combined to give a score reflecting the likelihood that the change is due to deforestation activity. Individual pixel intensities Intensity rise due to deforestation Relaxation Forest Background Baseline The optimisation procedure confirms that better results for the chosen region cannot be attained with this algorithm. It shows that although the algorithm is reasonably effective in distinguishing deforestation activity from other changes it has detected only ~10% of the area recorded as deforested by the databases. Standard deviation Time of change Results and discussion ScanSAR data only seems capable of detecting a low proportion of deforestation in the chosen region. However, evidence from Landsat and FBD images suggest that the databases may overestimate the extent of deforestation in some regions. This means that the values we have estimated for the recall are almost certainly lower bounds. In addition the meaning of deforestation is poorly defined and covers a range of different types of degradation It is also possible that we are detecting only the most severe industrial deforestation and that slash and burn or more subtle forest thinning and degradation is being missed by our methods, but recorded by the databases. False alarms that occur in other land-cover areas can be due to plantation management for example and very difficult to distinguish from deforestation. This suggests that use of the algorithm is limited to regions for which a land-cover map is available. The possibility of mapping forest using available data from ALOS is currently under investigation. By comparing natural forest regions delineated by the WWF 2008 and 2007 databases, areas that have been deforested in the interim can be deduced. These regions are compared with our detections for the corresponding period in this figure. Many target areas are correctly detected by our algorithm but much of the region designated as deforested according to the databases is currently missed. This image shows a RGB composite of ScanSAR images acquired January, September 2007 and June 2008 overlaid by detections for the period June 2007 – June 2008 and compared with regions deforested between April 2007 and June 2008 according to the WWF databases. The area shown is approximately 100X75 km. Also shown in the image are examples of detection types, labelled as follows: TP – True positive (correctly detection) FP – False positive (false alarm) FN – False negative – missed detection Email: m.whittle@sheffield.ac.uk; s.quegan@sheffield.ac.uk; kkkyulianto@yahoo.com; yumuryu@yahoo.com References [1] Uryu, Y., Mott C. et al. Deforestation, Forest Degradation, Biodiversity Loss and CO2 Emissions in Riau, Sumatra, Indonesia. WWF Indonesia Technical Report, December 2007. [2] Parker, C., et al. The Little REDD+ Book. An updated guide to governmental and non-governmental proposals for reducing emissions from Deforestation and degradation. 2009; Available from: www.globalcanopy.org.