Download
1 / 28
280 likes | 411 Views
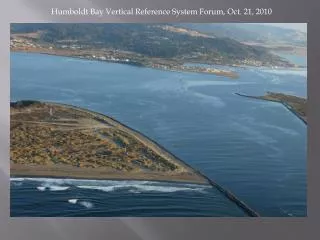
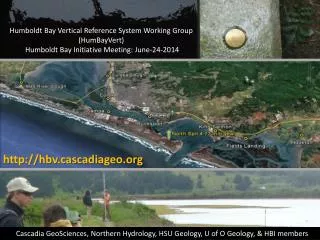
Humboldt Bay Vertical Reference System Working Group ( HumBayVert ) Summary of Findings & Science Plan Update Jul-8-2011. Cascadia GeoSciences , Northern Hydrology, HSU Geology, U of O Geology, & HBI members . First Workshop Oct. 21, 2010 What was discussed?

E N D
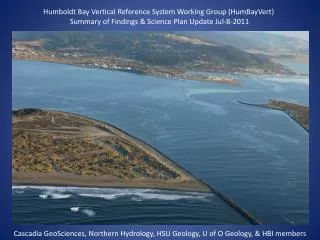
Humboldt Bay Vertical Reference System Working Group (HumBayVert) Summary of Findings & Science Plan Update Jul-8-2011 CascadiaGeoSciences, Northern Hydrology, HSU Geology, U of O Geology, & HBI members
First Workshop Oct. 21, 2010 • What was discussed? • Land level influencing local sea level • Discuss geologic processes • Review regional & local sea level • Discuss logistics of re-leveling HumBay
Mission and Goals • Determine historic land and sea level trends • Map local sea level change across region • Complete historic analysis of tide and level data in PNW • Model geologic processes controlling uplift/subsidence • Compare historic trends to prehistoric geologic record • Data dissemination for regional workers • Methods • Re-occupy historic tide gage locations • Install regional tide gage stations • Collect and analyze historic GPS & level data WRT mean sea level • Model CascadiaSubduction Zone with new data • Partnerships & collaboration
Bathymetry and topography of the Cascadia subduction zone 52Ê52Ê50Ê50Ê48Ê48Ê46Ê46Ê44Ê44Ê42Ê42Ê40Ê40Ê240Ê238Ê236Ê236Ê234Ê234Ê232Ê232Ê
Compare Rates & Test Observations Compare to tide gage observations Compare to GPS and land level surveys Compare to long term ESLR
Historic Temporary Tide Gage Locations, Humboldt Bay 1977-1980
Historic Leveling, Humboldt Bay 1931: San Jose – Eureka 1931: Eureka – Grants Pass 1944: Arcata – North Spit 1967: Longvale – Crescent City 1988: Eureka – Redding 1988: Westport – Arcata – North Spit 1992: Garberville – Loleta 2004: State Hwy – Countywide GPS Source: NGS Integrated Database; compiled by Don Campbell, CalTrans Dist. 1, 2010.
Historic Level Surveys: Weldon et al; Univ. of Oregon GPS Data: USGS processing of EarthScope and other GPS stations.
Rate of sea-level rise ~2.3 mm/yr (1977-2010)
Northcoast Sea Level Both NOAA’s calculated absolute sea level trend estimates and the more precise difference between the two sites suggest that North Spit subsides relative to Crescent City at about ~5.4 mm/yr. Given eustatic sea level rise of ~2.3 mm/yr for 1977 to 2010, Crescent City rises, absolutely, at ~3 mm/yr and North Spit sinks at about ~2.5 mm/yr. Ray Weldon, Oct. 2010
GPS Vertical Rates WRT to CC PBO USGS
Mad River Slough subsides relative to Crescent City at 4.2 mm/yr. • This indicates that Mad River Slough is sinking at a rate 1.2 mm/yr less than North Spit (5.4 mm/yr). Jeff Anderson, Northern Hydrology Engineering, Jan. 28 2010, HBI Meeting Mad River Slough Relative to North Spit Mad River Slough Relative to Crescent City • Mad River Slough subsides 0.9 mm/yr less than North Spit. • This estimate is close to above rate of 1.2 mm/yr. • The Crescent City estimate is probably more accurate due to length of record.
GPS Vertical Rates PBO USGS
Compare GPS data and Uplift Inferred from Sea Level Obs. Crescent City:2.3 (ESL) - -0.8 (RSL) = + 3.1 • GPS Station: PTSG = + 2.2 ± 0.8 • North Spit (a) : 2.3 (ESL) – 4.1 (RSL) = - 1.8 • (b) : - 5.4 (NS-CC) + (CC UL) = - 2.3 to -3.2 • Interpolated w/ GPS Stations: ((P162-P058)/2))+P058 = - 1.9 ± 0.6 • Mad River Slough (a) : 2.3 (ESL) – 3.1 (RSL)* = - 0.8 • (b) : -4.2 (MS-CC) + (CC UL) = - 1.1 to -2.0 • GPS Station: P058 = - 1.1 ± 0.5 • *Inferred from NHE analysis: • *(NS-CC) – (MRS-CC) = 0.9 – 1.2 mm/yr less subsidence per year between NS & MRS • mm/yr
Estimates of Secular Land Level Change Crescent City:2.5 mm/yr uplift = + 12.5 cm (5 in) / 50years • Mad River Slough/ Arcata:1 mm/yr subsidence = - 5 cm (- 2 in) / 50years • North Spit:2 mm/yr subsidence = - 10 cm (- 4 in) / 50years • South Bay / Table Bluff:2.7 mm/yr subsidence = - 13.5 cm (- 5.3 in) / 50years
Estimates of Relative Sea Level Change Crescent City:2.5 mm/yr uplift = + 12.5 cm (+ 4.9 in) / 50 yrs 2.3 mm/yr ESLR = + 11.5 cm (+ 4.5 in) / 50 yrs • RSL Change (- 0.2 mm/yr)= - 1 cm (- 0.4 in) / 50 yrs • Mad River Slough/ Arcata:1 mm/yr subsidence = - 5 cm (- 2 in) / 50yrs • 2.3 mm/yr ESLR = + 11.5 cm (+ 4.5 in) / 50 yrs • RSL Change (3.3 mm/yr) = + 16.5 cm (+ 6.5 in) / 50 yrs • North Spit:2 mm/yr subsidence = - 10 cm (- 4 in) / 50yrs • 2.3 mm/yr ESLR = + 11.5 cm (+ 4.5 in) / 50 yrs • RSL Change (4.3 mm/yr) = + 21.5 cm (+ 8.5 in) / 50 yrs • South Bay – Bear River:2.7 mm/yr subsidence = - 13.5 cm (- 5.3 in) / 50yrs • 2.3 mm/yr ESLR = + 11.5 cm (+ 4.5 in) / 50 yrs • RSL Change (5 mm/yr) = + 25 cm (+ 9.8 in) / 50 yrs
Ocean Surveys • 1. Deploy temporary tide gages at available historic tide gage locations • 1) Tie temporary gage to tidal bench mark • 2) Analyze 30 yr record of sea level rise • a) Humboldt Bay (6-9) • b) Trinidad • 2. Install and maintain tide gages and tidal bench marks • 1) Densify regional sea level observations • a) Trinidad Harbor & Shelter Cove • b) Humboldt Bay (3) , Eel River Delta, Klamath River • 2) Co-locate CGPS where/when possible. • 3. Upgrade water depth sensors in the Central and Northern California Ocean Observing System (CeNCOOS) • 1) Deploy stationary vented water depth sensors with external data loggers. • a) Humboldt Bay (5)
Land Surveys • Tie 1931, 1944, & 1967 level surveys to 1988 where possible; including tidal bench marks. • GPS survey subset of regional benchmarks to extend historic analysis to present day, and provide backbone of control to monitor on semi-annual basis. (Tidal bench marks and NAVD88 control) • Establish and monitor GPS-based level lines across Quaternary thrust faults utilizing both old & new control. • a) Little Salmon fault • b) Mad River fault zone • 4. Submit data to NGS for ‘blue booking’ to update survey control database (public). • Expert contractor • 5. Re-level selected NAVD88 level lines (most expensive).
GPS Height Modernization Program – Monitoring with CGPS as Reference • 1. Collect and process GPS observations in accordance to NGS Standards • Equipment: CalTrans, NGS, & HSU • 2. Maintain coordinates through repeated GPS surveys to update changes due to secular tectonic movement at both vertical and horizontal control. • Contracted processing facility • 3. Incorporate gravity observations to improve local geoid • USGS Menlo Park or Penn State Univ.
Data processing/archiving/dissemination/modeling • Analyze vertical rates of land level changes (1931, 1944, 1967, 1988, present). • Identify expert to ‘Blue Book’ new level data – submit to NGS to publish updates in NGS database. • Process all available regional GPS observations 1993-present. • Bring new tide gage and CGPS data online for daily downloads and real time data stream. • Model observed vertical uplift rates with subduction zone model. • Enduser Modeling; e.g. eel grass and mariculture habitat changes change due to tectonic uplift/subsidence.
Near Term Tasks To Strengthen Plan / Assessment • Request 2010 tide gage data from USACE. • Request all historic level surveys from the NGS. • Prioritize historic temporary tide gages based on length of original records. • Assess available CENCOOS and HBNWR water level data. • Assess short tie level surveys needed between historic survey lines.