Download

1 / 16
160 likes | 291 Views
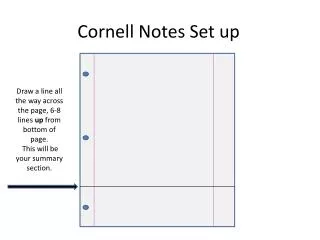
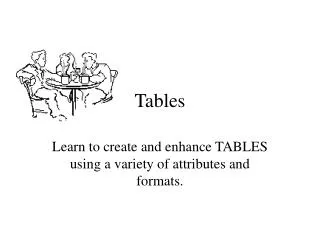
Data Analysis. Tables & Graphs Cornell Notes IAN Page 17. Source: The above ppt has been adapted to suit class. Key Questions. What is the purpose of a data table? What are the 3 key parts of a data table? What is the purpose of a graph? Describe two types of common graphs

E N D
Data Analysis Tables & Graphs Cornell NotesIAN Page 17 Source: The above ppt has been adapted to suit class.
Key Questions • What is the purpose of a data table? • What are the 3 key parts of a data table? • What is the purpose of a graph? • Describe two types of common graphs • How do I make a graph?
Purpose of a Data Table • Data table is used to: • Collect & record data during an experiment • Keep track of experimental trials
Key Parts of Data Table • Title • Tells purpose of experiment • Mentions both the I.V. & D.V. • Columns • Left usually used to record the I.V. from smallest to largest • Right usually used to record D.V. • Multiple trials are recorded as subdivisions of the D.V. column • Averages • The values of the multiple trials are averaged & recorded in a final RIGHT column, next to the D.V. column
Why Graph? • Graphs are used to represent your data findings • They help you analyze & communicate your data • Need graphs to help report your results
2 Common Graphs • Line Graph • Used when I.V. is a quantitative (involves numbers) measurement. When the data is continuous, in other words there are an infinite number of values in between two listed values. Examples: height, length, volume, mass, time, etc. • Bar Graph • Used when I.V. is qualitative (doesn’t involve numbers) or categorical or when COUNTING which does involve numbers, but there are not an infinite number of values in between. You can’t have 1.2 people. • Examples: days of the week, colors, types, brand names, counting,etc.
How to Make a Graph • Clearly label your title, y-axis, and x-axis • Include units and/or names • Ex: cm, seconds, brands, types, etc. • Remember to graph on the correct axes • I.V. goes on the x-axis • D.V. goes on the y-axis DRY MIX Dependent Responding YaxisManipulated Independent Xaxis
!!!Let’s Practice!!! • What is the relationship between the distance below the surface and the number of fossils collected? The students collected three buckets at each location. At 80 cm below there were 0, 0, and 1 fossil; 140 cm had 2, 3, and o fossils, 200 cm had 8, 10 and 7 fossils, 260 cm had 15, 16, and 16 fossils; and 320 cm had 32, 30, and 35 fossils.
!!!Let’s Practice!!! • What is the relationship between the distance below the surface and the number of fossils collected? The students collected three buckets at each location. At 80 cm below there were 0, 0, and 1 fossil; 140 cm had 2, 3, and o fossils, 200 cm had 8, 10 and 7 fossils, 260 cm had 15, 16, and 16 fossils; and 320 cm had 32, 30, and 35 fossils. Find the question and write it down where you plan to make your data table
!!!Let’s Practice!!! • What is the relationship between the distance below the surface and the number of fossils collected? The students collected three buckets at each location. At 80 cm below there were 0, 0, and 1 fossil; 140 cm had 2, 3, and o fossils, 200 cm had 8, 10 and 7 fossils, 260 cm had 15, 16, and 16 fossils; and 320 cm had 32, 30, and 35 fossils. Underline your IV & DV
!!!Let’s Practice!!! • What is the relationship between the distance below the surface and the number of fossils collected? The students collected three buckets at each location. At 80 cm below there were 0, 0, and 1 fossil; 140 cm had 2, 3, and o fossils, 200 cm had 8, 10 and 7 fossils, 260 cm had 15, 16, and 16 fossils; and 320 cm had 32, 30, and 35 fossils. Copy all of the I.V. data in one color. Copy all the D.V. data in another color
!!!Let’s Practice!!! • What is the relationship between the distance below the surface and the number of fossils collected? The students collected three buckets at each location. At 80 cm below there were 0, 0, and 1 fossil; 140 cm had 2, 3, and o fossils, 200 cm had 8, 10 and 7 fossils, 260 cm had 15, 16, and 16 fossils; and 320 cm had 32, 30, and 35 fossils. Copy all of the I.V. data in one color. I.V. D.V. Copy all the D.V. data in another color
!!!Let’s Practice!!! Now, draw the number of columns you think you will need and fill in the data where you think it belongs. Remember to include enough columns for multiple trials & averages (hint: You will use 5 columns?) • What is the relationship between the distance below the surface and the number of fossils collected? The students collected three buckets at each location. At 80 cm below there were 0, 0, and 1 fossil; 140 cm had 2, 3, and o fossils, 200 cm had 8, 10 and 7 fossils, 260 cm had 15, 16, and 16 fossils; and 320 cm had 32, 30, and 35 fossils.
Your table should look similar to this. D.V. Multiple Trials I.V.
!!!Now YOU try!!! • Decide which type of graph would be most appropriate for this set of data and create your graph • Remember to label and title and include relationship statement. Fossils collected vs. distance below the surface (cm) DRY MIX Relationship statement
Fossils collected vs. Distance below the surface (cm) 32 28 24 20 16 12 8 4 0 Number of fossils collected As the distance below the surface increases, the number of fossils collected increases exponentially 50 100 150 200 250 300 350 400 Distance below the surface in cm.