Download
1 / 2
20 likes | 90 Views
Real Time G-Meter with Peak/Hold ECE480 Team 4: Karl Anderson, Shuhan Chen, Corey Fox, Eric-John Kohler, Tim Carroll, Dan Svoboda Spring 2013. Abstract. Key Parameters. Hardware Design.

E N D
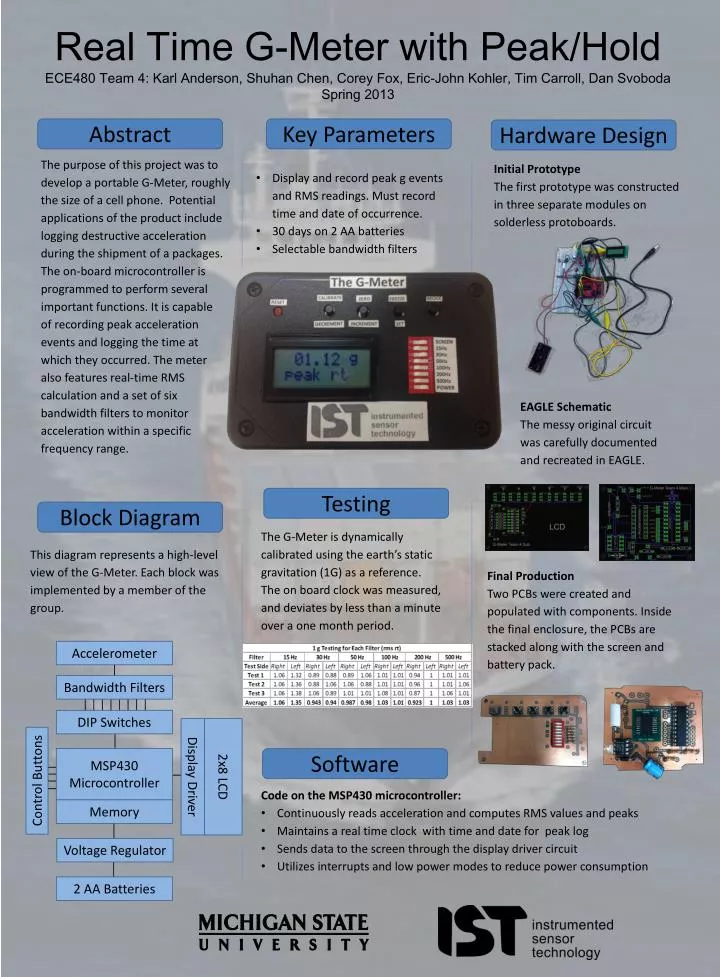
Real Time G-Meter with Peak/Hold ECE480 Team 4: Karl Anderson, Shuhan Chen, Corey Fox, Eric-John Kohler, Tim Carroll, Dan Svoboda Spring 2013 Abstract Key Parameters Hardware Design The purpose of this project was to develop a portable G-Meter, roughly the size of a cell phone. Potential applications of the product include logging destructive acceleration during the shipment of a packages. The on-board microcontroller is programmed to perform several important functions. It is capable of recording peak acceleration events and logging the time at which they occurred. The meter also features real-time RMS calculation and a set of six bandwidth filters to monitor acceleration within a specific frequency range. Initial Prototype The first prototype was constructed in three separate modules on solderless protoboards. • Display and record peak g events and RMS readings. Must record time and date of occurrence. • 30 days on 2 AA batteries • Selectable bandwidth filters EAGLE Schematic The messy original circuit was carefully documented and recreated in EAGLE. Testing Block Diagram The G-Meter is dynamically calibrated using the earth’s static gravitation (1G) as a reference. The on board clock was measured, and deviates by less than a minute over a one month period. This diagram represents a high-level view of the G-Meter. Each block was implemented by a member of the group. Final Production Two PCBs were created and populated with components. Inside the final enclosure, the PCBs are stacked along with the screen and battery pack. Accelerometer Bandwidth Filters DIP Switches Control Buttons MSP430 Microcontroller Software 2x8 LCD Display Driver • Code on the MSP430 microcontroller: • Continuously reads acceleration and computes RMS values and peaks • Maintains a real time clock with time and date for peak log • Sends data to the screen through the display driver circuit • Utilizes interrupts and low power modes to reduce power consumption Memory Voltage Regulator 2 AA Batteries
Real Time G-Meter with Peak/Hold ECE480 Team 4: Karl Anderson, Shuhan Chen, Corey Fox, Eric-John Kohler, Tim Carroll, Dan Svoboda Spring 2013 Abstract Key Parameters Hardware Design The purpose of this project was to develop a portable G-Meter, roughly the size of a cell phone. Potential applications of the product include logging destructive acceleration during the shipment of a packages. The on-board microcontroller is programmed to perform several important functions. It is capable of recording peak acceleration events and logging the time at which they occurred. The meter also features real-time RMS calculation and a set of six bandwidth filters to monitor acceleration within a specific frequency range. Initial Prototype The first prototype was constructed in three separate modules on solderless protoboards. • Display and record peak g events and RMS readings. Must record time and date of occurrence. • 30 days on 2 AA batteries • Selectable bandwidth filters EAGLE Schematic The messy original circuit was carefully documented and recreated in EAGLE. Testing Block Diagram The G-Meter is dynamically calibrated using the earth’s static gravitation (1G) as a reference. The on board clock was measured, and deviates by less than a minute over a one month period. This diagram represents a high-level view of the G-Meter. Each block was implemented by a member of the group. Final Production Two PCBs were created and populated with components. Inside the final enclosure, the PCBs are stacked along with the screen and battery pack. Accelerometer Corey’s g testing data here? Bandwidth Filters DIP Switches Control Buttons MSP430 Microcontroller Software 2x8 LCD Display Driver • Code on the MSP430 microcontroller: • Continuously reads acceleration and computes RMS values and peaks • Maintains a real time clock with time and date for peak log • Sends data to the screen through the display driver circuit • Utilizes interrupts and low power modes to reduce power consumption Memory Voltage Regulator 2 AA Batteries