Download
1 / 29
340 likes | 618 Views
Congestion Charging London. Sarah Green Congestion Charging and Traffic Enforcement Transport for London. Contents. Congestion Charging Scheme background Operation and enforcement Impacts of the scheme Scheme costs Re-Let Lessons Learnt. Central London Congestion Charging Zone.

E N D
Congestion ChargingLondon Sarah GreenCongestion Charging and Traffic EnforcementTransport for London
Contents • Congestion Charging • Scheme background • Operation and enforcement • Impacts of the scheme • Scheme costs • Re-Let • Lessons Learnt
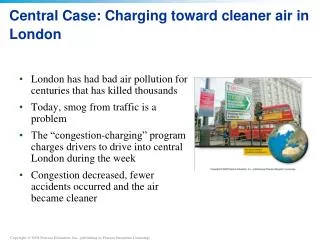
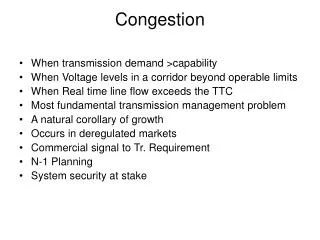
The Central London Scheme • 40% of England’s congestion is in London • Central London was the most congested area with average all day speeds of less than 9mph • Despite 85% public transport usage, vehicular traffic was still a major problem in Central London • The congestion persisted throughout the day – it was not a ‘peak’ commuter problem • To tackle this and using the most reliable technology available at the time, an area charging scheme covering the whole working day was developed
Charge payment • Daily, weekly, monthly or annual payment for individual vehicle registration number • Flat charge of £8 per day (was £5 until July 2005) until midnight • Monday – Friday, 7am – 6pm (was 6.30pm until February 2007) • Pay Next Day introduced 19 June 2006
Key exemptions and discounts • Buses, coaches and minibuses • Taxis and licensed minicabs • Motorbikes / mopeds • Military vehicles • Emergency services • Disabled persons • Certain alternative fuel vehicles • Breakdown and recovery vehicles • Certain health service workers • 90% discount for residents of zone Exempt and 100% discount currently account for c.30% of the total daily traffic of 180,000
If a valid payment is not received for correct vehicle for the correct date of travel then the Enforcement process commences Cameras are located on all routes into and out of the zone as well as many sites within the zone Signs are placed at every entry and exit point and up to 17 miles away on main arteries into London A comprehensive network of road markings exist on the boundaries of and within the zone Enforcement process
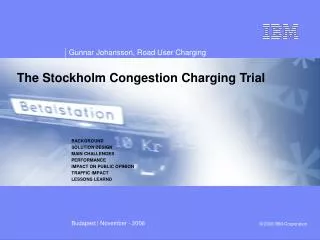
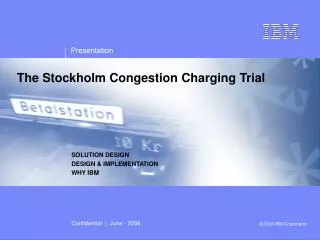
Detecting vehicles Stockholm 2006 Cameras in London TfL testing site Borough High St
Vehicle registration numbers observed by 1,360 cameras at 348 sites, located both on boundary and locations within the zone 1.45 million images are captured and processed every charging day - cameras linked to automatic number plate recognition (ANPR) technology Opportunity to make representation to TfL and appeal to an independent adjudicator Enforcement numbers
Vehicle number plate processing ABC 123 65% ABC 123 62% ABC 123 92% ABC 123 ABC 123 84% ABC 123 41% During the day the system constantly checks new images/ interpretations against those already stored By the end of the day only the best, highest quality images and interpretation progresses through to the next stage of the enforcement process
Enforcement processing TfL Lists of number plates sent using DVLA WEE batch by 2am the second working day after the end of the charging day DVLA Name and address of keeper,VRM, and make, model and colour of vehicle Details returned to TfL by 7am next morning
PCN issue and post checking • Images and key data for every possible Penalty Charge is manually checked before issue • Number plate, Make and Model of vehicle advised by DVLA matched against image • Any “mismatch” rejected for further investigation or deletion
Traffic impacts of Congestion Charging Central zone Western extension 14% reduction in traffic entering extension 30,000 fewer vehicles per day Increase in bus passengers • 21% reduction in traffic (4 or more wheels) entering the zone – has remained constant • 70,000 fewer vehicles per day • Bus patronage up, bus services performing better • Little change in trips to central area with 50-60% moving to public transport
Average daily traffic entering charging zoneDuring charging hours (07.00-18.00) Normally Charge Paying Normally Non-Charge Paying
Average daily traffic entering charging zoneDuring charging hours (07.00-18.00) In 2002, before Congestion Charging began, there was an average of 185,000 cars entering the charging zone every charging day Normally Charge Paying Normally Non-Charge Paying
Average daily traffic entering charging zoneDuring charging hours (07.00-18.00) In 2003, after charging was introduced, this fell to an average of 124,000 cars entering the charging zone every day Normally Charge Paying Normally Non-Charge Paying
Average daily traffic entering charging zone During charging hours (07.00-18.00) Since then the traffic volumes have been largely unchanged, with little difference caused by the shift from £5 to £8 in 2005 The decrease in cars between 2002 and 2007 is some 36% Normally Charge Paying Normally Non-Charge Paying
Average daily traffic entering charging zone During charging hours (07.00-18.00) Similarly there has been a 13% fall in vans and 7% fall in lorries entering central London since the introduction of Congestion Charging Normally Charge Paying Normally Non-Charge Paying
Average daily traffic entering charging zone During charging hours (07.00-18.00) In comparison vehicles types that would not normally pay the charge have remained broadly stable or increased – with buses up 31% and bicycles up 66% between 2002 and 2007 Normally Charge Paying Normally Non-Charge Paying
Average daily traffic entering charging zoneDuring charging hours (07.00-18.00) Congestion Charging led to a dramatic and immediate reduction in the volumes of traffic in central London – and profoundly changed the pattern of vehicles seen Five years on the effects of Congestion Charging on traffic are as significant as they were when the scheme was first introduced Normally Charge Paying Normally Non-Charge Paying
Congestion • Congestion in central zone was initially down, but has gradually increased despite reduced traffic levels: • 2003: 30% down • 2005: 21% down • 2006: 8% down • 2007: no change • In early months of the WEZ, significant congestion reductions, but recent results show congestion now similar to pre-extension levels • Traffic levels still reduced - increased congestion due to decreased effective capacity as a result of road works and road space allocation to improve conditions for other users
So why has congestion returned? • Reflects a reduction in effective capacity of road network for general traffic • Urban realm improvement schemes (e.g. Trafalgar Square) • Pedestrian, cyclist and bus priority measures • Increased road works by utilities (particularly water mains) and major developments (e.g. Scotch House Corner development in WEZ) • Important to balance priorities – activity being undertaken to address congestion levels
Revenues • Net revenues by law must be spent on transport • Raised total of £268m in 2007/8 • Scheme costs totalled £131m • Net revenues therefore £137m • Allocation of 2007/08 revenues was • £112m - Bus improvements • £13m - Roads and bridges • £4m - Road safety • £4m - Walking and Cycling • £2m - Borough plans • £2m - Environment
Western Extension Consultation • Mayor asked TfL to seek Londoners' views on the future of the Western Extension (WEZ) • The consultation outlined three options: • Keep WEZ as it is • Remove the WEZ • Change the WEZ • Consultation finished on 5 October and results were strongly in favour of scrapping the Western Extension
Re-Let • Contract with existing provider, Capita, ends in October 2009 • Went through a Competitive Dialogue process seeking a company or consortium to deliver • Technology • Customer services • Enforcement • Re-Let provides an excellent opportunity to • Make use of new technology to deliver the scheme • Reduce costs • Introduce further customer improvements • TfL announced in October 2007 that IBM UK Ltd had been selected as the successful bidder
Lessons Learnt from Congestion Charging • Political commitment key • Effective research and clear policy objectives • Extensive public consultation and stakeholder engagement • Strong project management • Need for effective contract management • Adequate public transport alternatives • Effective traffic management • Strong public information campaign • Need for ongoing customer and impacts monitoring, stakeholder engagement and scheme improvements