CHAPTER 9 Oscilloscopes and Graphing Multimeters
300 likes | 469 Views
CHAPTER 9 Oscilloscopes and Graphing Multimeters. OBJECTIVES. After studying Chapter 9, the reader will be able to: Prepare for ASE Electrical/Electronic Systems (A6) certification test content area “ A ” (General Electrical/Electronic System Diagnosis).

CHAPTER 9 Oscilloscopes and Graphing Multimeters
E N D
Presentation Transcript
CHAPTER 9 Oscilloscopes and Graphing Multimeters
OBJECTIVES After studying Chapter 9, the reader will be able to: • Prepare for ASE Electrical/Electronic Systems (A6) certification test content area “A” (General Electrical/Electronic System Diagnosis). • Use a digital storage oscilloscope to measure voltage signals. • Interpret meter and scope readings and determine if the values are within factory specifications. • Explain time base and volts per division settings.
AC coupling BNC connector Cathode ray tube (CRT) Channel DC coupling Digital storage oscilloscope (DSO) Division Duty cycle External trigger Frequency GMM Graticule Hertz Oscilloscope (scope) Pulse train Pulse width PWM Time base Trigger level Trigger slope KEY TERMS
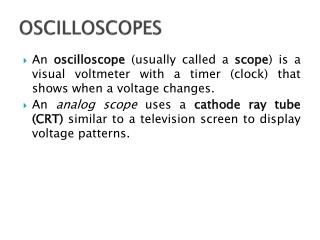
TYPES OF OSCILLOSCOPESTERMINOLOGY • An oscilloscope (usually called a scope ) is a visual voltmeter with a timer that shows when a voltage changes. • Following are several types of oscilloscopes. • An analog scope • A digital scope
FIGURE 9–1 A scope display allows technicians to take measurements of voltage patterns. In this example, each vertical division is 1 volt and each horizontal division is set to represent 50 milliseconds. TYPES OF OSCILLOSCOPESOSCILLOSCOPE DISPLAY GRID
SCOPE SETUP AND ADJUSTMENTS • SETTING THE TIME BASE • VOLTS PER DIVISION
FIGURE 9–2 The display on a digital storage oscilloscope (DSO) displays the entire waveform from idle to wide-open throttle and then returns to idle. The display also indicates the maximum reading (4.72 V) and the minimum (680 mV or 0.68 V). The display does not show anything until the throttle is opened, because the scope has been set up to only start displaying a waveform after a certain voltage level has been reached. This voltage is called the trigger or trigger point. SCOPE SETUP AND ADJUSTMENTS
DC AND AC COUPLING • DC COUPLING • DC coupling is the most used position on a scope because it allows the scope to display both alternating current (AC) voltage signals and direct current (DC) voltage signals present in the circuit. • AC COUPLING • When the AC coupling position is selected, a capacitor is placed into the meter lead circuit, which effectively blocks all DC voltage signals but allows the AC portion of the signal to pass and be displayed.
FIGURE 9–3 Ripple voltage is created from the AC voltage from an alternator. Some AC ripple voltage is normal but if the AC portion exceeds 0.5 volt, then a bad diode is the most likely cause. Excessive AC ripple can cause many electrical and electronic devices to work incorrectly. DC AND AC COUPLING
FIGURE 9–4 A pulse train is any electrical signal that turns on and off, or goes high and low in a series of pulses. Ignition module and fuel-injector pulses are examples of a pulse train signal. PULSE TRAINS • DEFINITION • FREQUENCY • DUTY CYCLE • PULSE WIDTH
FIGURE 9–5 (a) A scope representation of a complete cycle showing both on-time and off-time. (b) A meter display indicating the on-time duty cycle in a percentage (%). Note the trigger and negative (-) symbol. This indicates that the meter started to record the percentage of on-time when the voltage dropped (start of on-time). PULSE TRAINS
FIGURE 9–6 Most automotive computer systems control the device by opening and closing the ground to the component. PULSE TRAINS
FIGURE 9–7 A two-channel scope being used to compare two signals on the same vehicle. NUMBER OF CHANNELS • DEFINITION • A channel is an input to a scope. • Commonly available scopes include: • Single channel • Two channel • Four channel
FIGURE 9–8 (a) A symbol for a positive trigger—a trigger occurs at a rising (positive) edge of the signal (waveform). (b) A symbol for a negative trigger—a trigger occurs at a falling (negative) edge of the signal (waveform). TRIGGERS • EXTERNAL TRIGGER • TRIGGER LEVEL • TRIGGER SLOPE
FIGURE 9–9 Battery voltage is represented by a flat horizontal line. In this example, the engine was started and the battery voltage dropped to about 10 V as shown on the left side of the scope display. When the engine started, the alternator started to charge the battery and the voltage is shown as climbing. USING A SCOPE • USING SCOPE LEADS • MEASURING BATTERY VOLTAGE WITH A SCOPE
FIGURE 9–10 A typical graphing multimeter that can be used as a digital meter, plus it can display the voltage levels on the display screen. GRAPHING MULTIMETER • A graphing multimeter , abbreviated GMM , is a cross between a digital meter and a digital storage oscilloscope. • A graphing multimeter displays the voltage levels at two places: • On a display screen • In a digital readout
GRAGHING SCAN TOOLS • Many scan tools are capable of displaying the voltage levels captured by the scan tool through the data link connector (DLC) on a screen. • This feature is helpful where seeing changes in voltage levels is difficult to detect by looking at numbers that are constantly changing. • Read and follow the instructions for the scan tool being used.
SUMMARY • Analog oscilloscopes use a cathode ray tube to display voltage patterns. • The waveforms shown on an analog oscilloscope cannot be stored for later viewing. • A digital storage oscilloscope (DSO) creates an image or waveform on the display by connecting thousands of dots captured by the scope leads. • An oscilloscope display grid is called a graticule. Each of the 8 x 10 or 10 x 10 dividing boxes is called a division.
SUMMARY • Setting the time base means establishing the amount of time each division represents. • Setting the volts per division allows the technician to view either the entire waveform or just part of it. • DC coupling and AC coupling are two selections that can be made to observe different types of waveforms. • A graphing multimeter is not capable of capturing short duration faults but can display usable waveforms. • Oscilloscopes display voltage over time. A DSO can capture and store a waveform for viewing later.
REVIEW QUESTIONS • What are the differences between an analog and a digital oscilloscope? • What is the difference between DC coupling and AC coupling? • Why are DC signals that change called pulse trains? • What is the difference between an oscilloscope and a graphing multimeter?
CHAPTER QUIZ 1. Technician A says an analog scope can store the waveform for viewing later. Technician B says that the trigger level has to be set on most scopes to be able to view a changing waveform. Which technician is correct? • Technician A only • Technician B only • Both Technicians A and B • Neither Technician A nor B
CHAPTER QUIZ 2. An oscilloscope display is called a ________. • Grid • Graticule • Division • Box
CHAPTER QUIZ 3. A signal showing the voltage of a battery displayed on a digital storage oscilloscope (DSO) is being discussed. Technician A says that the display will show one horizontal line above the zero line. Technician B says that the display will show a line sloping upward from zero to the battery voltage level. Which technician is correct? • Technician A only • Technician B only • Both Technicians A and B • Neither Technician A nor B
CHAPTER QUIZ 4. Setting the time base to 50 ms per division will allow the technician to view a waveform how long in duration? • 50 ms • 200 ms • 400 ms • 500 ms
CHAPTER QUIZ 5. A throttle position sensor waveform is going to be observed. At what setting should the volts per division be set to see the entire waveform from 0 to 5 volts? • 0.5 V/division • 1.0 V/division • 2.0 V/division • 5.0 V/division
CHAPTER QUIZ 6. Two technicians are discussing the DC coupling setting on a DSO. Technician A says that the position allows both the DC and AC signals of the waveform to be displayed. Technician B says that this setting allows just the DC part of the waveform to be displayed. Which technician is correct? • Technician A only • Technician B only • Both Technicians A and B • Neither Technician A nor B
CHAPTER QUIZ 7. Voltage signals (waveforms) that do not go below zero are called ________. • AC signals • Pulse trains • Pulse width • DC coupled signals
CHAPTER QUIZ 8. Cycles per second are expressed in ________. • Hertz • Duty cycle • Pulse width • Slope
CHAPTER QUIZ 9. Oscilloscopes use what type of lead connector? • Banana plugs • Double banana plugs • Single conductor plugs • BNC
CHAPTER QUIZ 10. A digital meter that can show waveforms is called a ________ . • DVOM • DMM • GMM • DSO