Download
1 / 25
250 likes | 344 Views
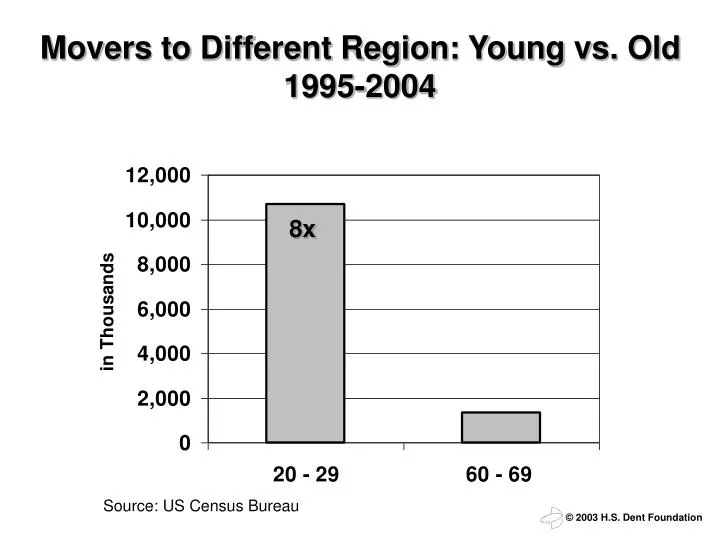
Movers to Different Region: Young vs. Old 1995-2004. 8x. Source: US Census Bureau. Movers to a Different Region by Age 1995-2004. Source: US Census Bureau. The Migration Wave 25- to 27-Year Lag for Peak Movers. Average Immigrants per Year by Age 1945-2000. Source: US Census Bureau.

E N D
Movers to Different Region: Young vs. Old1995-2004 8x Source: US Census Bureau
Movers to a Different Region by Age1995-2004 Source: US Census Bureau
Average Immigrants per Year by Age1945-2000 Source: US Census Bureau
Immigration to the United States1820-2006 Source: U.S. Department of Homeland Security
Top 10 Outbound States2003-2007 Source: United Van Lines
Top 10 Inbound States2003-2007 Source: United Van Lines
Migration into South Atlantic States% of Interstate Migration that is Inbound Source: United Van Lines
Migration into Inland Southeast States% of Interstate Migration that is Inbound Source: United Van Lines
Migration into Southwestern States% of Interstate Migration that is Inbound Source: United Van Lines
Migration into Western States% of Interstate Migration that is Inbound Source: United Van Lines
Migration out of Upper Midwest States% of Interstate Migration that is Outbound Source: United Van Lines
Migration out of Midwest States% of Interstate Migration that is Outbound Source: United Van Lines
Migration out of Northeastern States% of Interstate Migration that is Outbound Source: United Van Lines
Migration by Size of Metro Area1995 to 2000 Source: US Census Bureau
Migration by Size of Metro Area2000 to 2003 Source: US Census Bureau
Cities in the Sweet Spot1 Million – 2 Million Source: Population Division, U.S. Census Bureau
Cities Approaching the Sweet Spot750,000 – 1 Million Source: Population Division, U.S. Census Bureau
U.S. Metro Areas With Highest GrowthApril 1, 2000-July 1, 2006 Source: US Census Bureau
Fastest-Growing U.S. Metro AreasApril 1, 2000- July 1, 2006 Source: US Census Bureau
By the Texas Transportation Institute's reckoning, the cities having the worst traffic problems are:
Migration into Southeastern States1995 to 2004 Source: US Census Bureau
Migration into Southwestern States1995 to 2004 Source: US Census Bureau
Migration into Northwestern & Rockies States1995 to 2004 Source: US Census Bureau