Download

1 / 25
250 likes | 345 Views
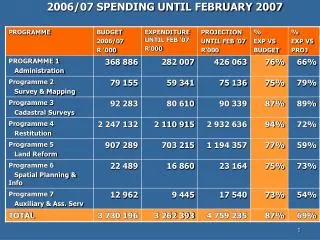
District Accountability Update May 2006 - February 2007. District Accountability Results. Districts provided three sets of accountability results District Performance Score (DPS) – calculated in same manner as a School Performance Score

E N D
District Accountability Update • May 2006 - February 2007
District Accountability Results • Districts provided three sets of accountability results • District Performance Score (DPS) – calculated in same manner as a School Performance Score • District Responsibility Indicators – three separate indicators • District Subgroup Component – used to determine if the district’s subgroups made Adequate Yearly Progress (AYP) Bulletin 111, Chapter 43
District Performance Scores • Calculated in the same manner as School Performance Scores • Do not include assessment results for students displaced by the hurricanes • Include one year of assessment data (2005-06) and one year of attendance and dropout data (2004-05) Bulletin 111, Section 4317
District Performance Score Labels Bulletin 111, Section 4311
District Responsibility Indicators • For the 2006 District Accountability results, the District Responsibility Index (DRI) and the labels associated with it have been eliminated • Three separate District Responsibility Indicators have been added • Teacher Certification Indicator • 8th Grade Persistence Indicator • Financial Risk Indicator Bulletin 111, Sections 4301
Teacher Certification Indicator • Based on the percentage of state core classes taught by three categories of teachers • Standard Teaching Certificate for area of assignment • Non-Standard Teaching Certificate – Out of Field or Temporary Authority (OFAT, TAT, TEP) • No Authority to Teach (No Certification) Bulletin 111, Section 4302
Teacher Certification Indicator • Two Indices calculated • Low Performing schools (1 Star or Academically Unacceptable) • Not Low Performing (2 Stars or above) Bulletin 111, Sections 4302
Teacher Certification Indicator • Percentages of state core classes taught by teachers in each category weighted and converted to point using the following weighting factors: • 1.0 times % of classes taught by teachers with Standard Certificates • 0.5 times % of classes taught by teachers with Non-Standard Certificates • 0.0 times % of classes taught by teachers with No Authority to Teach Bulletin 111, Sections 4302
Teacher Certification Indicator • Weighted points are summed for Low Performing schools and again for Non-Low Performing schools • Total points for Low Performing schools are weighted by 75% • Total points for Non-Low Performing schools are weighted by 25% • Indicator value is the sum of the weighted total points for Low and Non-Low Performing schools Bulletin 111, Sections 4302
Teacher Certification Indicator Bulletin 111, Section 4302
8th Grade Persistence Indicator • Based upon a district’s success in keeping 8th grade students enrolled (not drop out) • Uses two years of data (2006 results are based on data from the years 2003-04 and 2004-05) Bulletin 111, Sections 4302
8th Grade Persistence Indicator • Enrolled Count – students who were enrolled in the district at least one full day during an academic year, less those students who left for legitimate reasons • Returned Count – prior year enrolled students who are also enrolled at least one full day of the next academic year Bulletin 111, Sections 4302
8th Grade Persistence Indicator • Sum enrolled counts from the two years • Sum returned counts from the two years • Divide the total returned counts by the total enrolled counts Bulletin 111, Sections 4302
8th Grade Persistence Indicator Bulletin 111, Section 4302
Financial Risk Indicator • Created by Education Finance in 2004-05 to quantify a district’s financial risk • Currently being revised by BESE • Will be used in subsequent years once revisions are complete Bulletin 111, Sections 4302
District Subgroup Component AYP • For the Annual Measurable Objectives (AMO) percent proficiency analysis, ELA and math assessments from grades 3-8 and 10 are included • For the “Safe Harbor” percent proficiency improvement comparison, only 4th, 8th and 10th grade ELA and math results are used Bulletin 111, Section 4310
District Subgroup Component AYP • Students displaced by the hurricane were placed in a separate subgroup and removed from all other subgroups • The Displaced Students subgroup were only evaluated on their Participation • If the Displaced Students subgroup failed the Participation evaluation for a particular grade cluster, the district failed Subgroup Component AYP Bulletin 111, Section 4310
District Consequences • Since DRI labels have been eliminated from District Accountability, district consequences only apply to failure to achieve Adequate Yearly Progress (AYP) in the Subgroup Component for all three Grade-Clusters in the same subject, Bulletin 111, Section 4313
Districts Exiting District Improvement • Districts exit District Improvement if they pass the Subgroup Component AYP in the same subject for which they entered District Improvement in the same cluster for 2 consecutive years. Bulletin 111, Sections 4313
Districts Exiting District Improvement • Example: • District fails Subgroup Component AYP in ELA for all three grade clusters two consecutive years and is placed in District Improvement • District then passes the Elementary Cluster for ELA for two consecutive years • District is no longer in District Improvement Bulletin 111, Sections 4313
District Academically in Crisis • District is labeled Academically in Crisis if • More than 30 schools in the district are Academically Unacceptable OR • More than 50% of the district’s enrollment attends Academically Unacceptable schools Bulletin 111, Sections 4901
District Accountability Hurricane Considerations • Districts are considered “Severe Impact” districts and receive a one-year waiver from accountability labels and decisions if, due to a disaster: • Closed for 18 or more consecutive school days • Gained or lost 25% of testing population before Oct. 1 • Have 25% or more of their schools granted a one-year waiver or classified as new schools Bulletin 111, Section 4503
Questions? • Kevin.Stansbury@la.gov • Thomas.Spencer@la.gov