Download
1 / 42
420 likes | 546 Views
Explore the innovative approach of Visual Game Tuning (VGT), which integrates interactive visualizations into game development. As games become increasingly complex and costly to develop, VGT offers transformative solutions that simplify debugging, improve testing, and reduce development expenses. Using real-time feedback and quantitative analysis, developers can assess player experiences, ensuring optimal game "feel." This presentation delves into the methodologies and future prospects of VGT, highlighting its potential to reshape the gaming industry by making the development process more efficient and insightful.

E N D
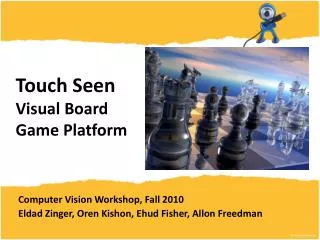
Visual Game Tuning Integrating Interactive Visualizations into Game Development
Why InfoVis & Gaming? • Games are increasingly: • Complex • Hard to debug • Hard to test • Expensive to develop
Why InfoVis & Gaming? • Information Visualization can: • Help reduce complexity • Give insight into processes • Assist the debugging process • Reduce cost
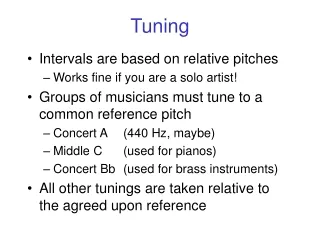
Drift! – the racing game • 1992 Mazda RX-7 • 236bhp, 156mph top speed, 0-50mph in 4.4s • How much does this matter in a video game? • It depends on the game! • What does matter? • The “feel”
Drift! – the racing game • How do we define “feel” ? • Perceived: Rigidity, Acceleration, Speed, etc… • Reality means less here • How do we find the “correct” feel? • QA Cycles
Testing Approaches • Bug-tracking systems (JIRA, BugZilla, Mantis) • Playtests • Subject Matter Experts • Heuristic Analysis (more on this later)
Traditional QA Process • If the tuning process works, why change? • The average AAA Game: • Costs $28 million to develop • 3 years to produce • Requires constant testing by the QA staff • Requires constant revision by the developers
VGT-game client Steering is too stiff!
1. Overview VGT-vis client 2. Zoom & Filter
2. Zoom & Filter • Zoom on most recent timeframe
3. Detail • Look for potential relationships
VGT-game client “Dislike” “Like” Steering is too stiff! This is too hard! Try reducing speeds?
5. History • Using Indicators, we can assess user feedback
VGT-game client Much Better!
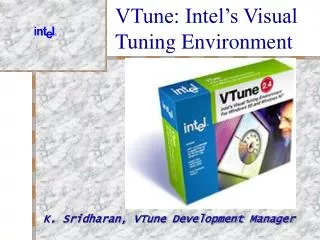
Visualization - Protovis • Stanford Visualization Group • Web-based (Javascript) • High Level Abstraction • Declarative Syntax
Game - Unity3D • Cross-platform • High-level language support (C#, Javascript) • Web-enabled • High performance
Tuning Middleware(ActionScript / RTMP) • vis client update protocol • game client update protocol
VGT Future Work • More middleware needed • Database logging • A server to take care of deeper analysis • Allows for mobile lightweight clients (tablets) • Formal evaluation of cost savings • Does VGT put more burden on QA?
Heuristics • Quantitative analysis of player actions • Statistical approach to game design • Gives a way to compare different approaches
Heuristics • Heuristic Evaluation for Playability (HEP) • Desurvire, H., Caplan, M., & Toth, J. A. (2004). Using Heuristics to Evaluate the Playability of Games. • Born out of the need for a standardized way to evaluate player feedback • Focuses on relevant gaming concerns
Interactive Visualizations • Scattering Points in Parallel Coordinates • Yuan, Guo, Xiao, Zhou, & Qu, 2009
Interactive Visualizations • Interactive Dimension Reduction through User-Defined Combinations of Quality Metrics • Johansson & Johansson, 2009
Interactive Visualizations • Lark: Using Meta-Visualizations for Coordinating Collaboration • Tobiasz, 2010