Download
1 / 30
330 likes | 513 Views
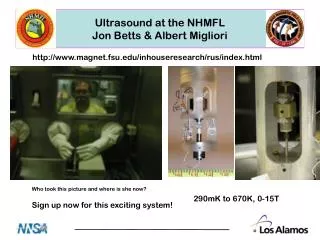
Ultrasound at the NHMFL Jon Betts & Albert Migliori. http://www.magnet.fsu.edu/inhouseresearch/rus/index.html. Who took this picture and where is she now?. 290mK to 670K, 0-15T. Sign up now for this exciting system!. Elastic Constants. Heat Capacity Thermal Expansion Elastic Moduli

E N D
Ultrasound at the NHMFLJon Betts & Albert Migliori http://www.magnet.fsu.edu/inhouseresearch/rus/index.html Who took this picture and where is she now? 290mK to 670K, 0-15T Sign up now for this exciting system!
Elastic Constants Heat Capacity Thermal Expansion Elastic Moduli Magnetization Electric polarization …are all primary thermodynamic quantities • For cubic symmetry: becomes
Elasticity—we like it! Mass and spring Solid and Temperature moduli Symmetrized strains This is the elastic energy. We measure adiabatic elastic moduli--For band structure guys, adiabatic means leave electron occupation numbers fixed and deform—the very easiest thing to do!
Elasticity and entropy The sound speeds (the dispersion curves) determine characteristic vibrational temperature-and most of the entropy at high T. Not the Debye Temperature If phases with lots of entropy are accessible, they tend to become the stable high-T phase. Entropy goes up with: Electronic instabilities Structural instabilities Soft structures ……
Elasticity We almost always usually measure at constant pressure Difference between constant volume and constant pressure is a very big deal. B almost always decreases with T at constant pressure but: B almost always increases with T at constant volume if not, something new is happening! b= thermal expansion, Cp=specific heat per unit mass at constant pressure, B= bulk modulus, r =1/V= density, w=mode frequency
Elastic moduli: the usual temperature dependence Varshni figured this out We can get g from either thermal expansion or elastic moduli
ZrW2O8-Structure and Thermal Expansion Figure 1. A. P Ramirez and G. R. Kowach, Phys. Rev. Letters, 80, 22 (1998) Figure 2. G. Ernst, C. Broholm, G. Kowach, and A. Ramirez, Nature 396, 147 (1998).
Experimental Results on ZrW2O8 The contracting solid gets softer, opposite what most materials do, and the change is an order of magnitude too large. Oops! It’s negative Shear modulus change is normal= 7%
The framework solid model M.E. Simon and C. M. Varma, Phys. Rev. Lett. 86, 1782 (2001) Rigid squares, floppy bonds Cold—the square has the biggest area. Hot—the average area is reduced! This is a “thermodynamic” model-it has enough degrees of freedom.
Why monocrystals are important ZrW2O8 Pressure induced phase transition at 5.8kbar Neutron scattering studies of powder samples published in Science got this wrong—the stress risers in grains of powder produce signatures of the phase transition well below the actual transition—the transition was reported at 2kbar. Pulse-echo on monocrystals gets it right! For this material, maybe the incipient phase transition with pressure is the source of all weirdness
(Required viewgraph) Only Pu exhibits so many phases in such a small (< a factor of 2) temperature range. This? Or this? Is Pu the second most interesting element? UNCLASSIFIED
What is RUS? Resonant ultrasound spectroscopy (RUS) uses the mechanical resonances of small samples to extract the elastic modulus tensor. RUS and other ultrasound techniques measure the ADIABATIC moduli, while mechanical testers and optical probes measure the isothermal ones! The difference may be important, and depends on the thermal expansion, specific heat and moduli!
Resonant Ultrasound Spectroscopy • Measurement of the resonances of small samples having accurate geometry is the key
…on data like these… • About 2nV/(Hz)-1/2 makes 10mV signals look like this at information-theory limited speeds from 10 pF transducers at from 600 Hz up to 9MHz.
….and a non-finite element approach like this-8 hours on a PC-AT, 1 second on a Cray YMP0.08 seconds on this laptop computer
RUS has important applications to nondestructive testing First Launch of the Trident II • Resonances can be used to determine manufacturing flaws. Below is shown a spectrum taken from a Si3N4 ball bearing used in the space shuttle. The error in roundness causes two degenerate resonances to split. The splitting determines the error in roundness. NOT LIKE THIS (from The Economist)
... and produce elastic moduli such that Be S200F Polycrystal free moduli are c11, c44 using 10 order polynomials mass= 0.4934 gm rho= 1.842 gm/cc n fex fr %err wt k i df/d(moduli) 1 0.633839 0.633252 -0.09 1.00 4 1 0.00 1.00 2 0.635551 0.635684 0.02 1.00 4 2 0.00 1.00 3 0.833434 0.833971 0.06 1.00 6 2 0.21 0.79 4 0.835120 0.835210 0.01 1.00 1 2 0.22 0.78 5 0.835391 0.836387 0.12 1.00 7 2 0.21 0.79 6 0.861719 0.861065 -0.08 1.00 6 3 1.26-0.26 7 0.862282 0.862273 0.00 1.00 3 2 0.08 0.92 8 0.862721 0.862542 -0.02 1.00 1 3 1.26-0.26 9 0.000000 0.863094 0.00 0.00 8 2 0.08 0.92 10 0.864708 0.863590 -0.13 1.00 7 3 1.26-0.26 11 0.864954 0.863766 -0.14 1.00 2 2 0.08 0.92 12 0.981956 0.982200 0.02 1.00 2 3 0.63 0.37 13 0.982327 0.983148 0.08 1.00 8 3 0.63 0.37 14 0.984162 0.984318 0.02 1.00 3 3 0.63 0.37 15 0.000000 0.986349 0.00 0.00 5 1 0.00 1.00 16 0.000000 0.987323 0.00 0.00 5 2 0.00 1.00 17 0.000000 0.988265 0.00 0.00 5 3 0.00 1.00 18 1.021700 1.022765 0.10 1.00 5 4 1.18-0.18 19 1.023870 1.023852 0.00 1.00 5 5 1.18-0.18 20 1.057160 1.057543 0.04 1.00 5 6 2.32-1.32 21 1.185330 1.185270 -0.01 1.00 6 4 0.49 0.51 22 0.000000 1.185470 0.00 0.00 1 4 0.49 0.51 23 0.000000 1.185631 0.00 1.00 7 4 0.49 0.51 24 1.188630 1.187391 -0.10 1.00 4 3 0.30 0.70 25 1.218560 1.219204 0.05 1.00 2 4 0.04 0.96 26 1.220240 1.220656 0.03 1.00 8 4 0.04 0.96 Bulk Modulus= 116.6 GPa c11 c66 315.5 149.2 d1 d2 d3 0.64471 0.64572 0.64348 loop# 1 rms error= 0.0704 % chisquare increased 2% by the following % changes in independent parameters 0.02 0.01 0.00 0.03 BeSingle Crystal free moduli are c33, c23 ,c12 ,c44, c66 using 10 order polynomials mass= 0.2264 gm rho= 1.842 gm/cc n fex fr %err wt k i df/d(moduli) 1 0.635039 0.635302 0.04 1.00 4 1 0.00 0.00 0.00 0.29 0.71 2 0.788106 0.788153 0.01 1.00 6 2 0.00 0.00 0.05 0.15 0.79 3 0.835332 0.834795 -0.06 1.00 1 2 0.00 0.00 0.07 0.00 0.93 4 0.959970 0.957946 -0.21 1.00 3 2 0.00 0.00 0.01 0.00 0.99 5 0.999543 1.001015 0.15 1.00 6 3 0.01 0.00 0.08 0.16 0.76 6 1.036990 1.034969 -0.19 1.00 5 1 0.00 0.00 0.05 0.00 0.95 7 1.047030 1.047225 0.02 1.00 4 2 0.00 0.00 0.00 0.91 0.09 8 1.075950 1.076550 0.06 1.00 7 2 0.00 0.00 0.07 0.00 0.93 9 1.121610 1.122433 0.07 1.00 2 2 0.01 0.00 0.03 0.35 0.61 10 1.149920 1.150491 0.05 1.00 5 2 0.00 0.00 0.07 0.00 0.93 11 1.160580 1.161102 0.04 1.00 8 2 0.01 0.00 0.01 0.69 0.30 12 1.195890 1.196787 0.08 1.00 8 3 0.01 0.00 0.06 0.41 0.53 13 1.254030 1.253338 -0.06 1.00 5 3 0.01-0.01 0.11 0.00 0.89 14 1.283260 1.280404 -0.22 1.00 2 3 0.01 0.00 0.01 0.89 0.09 15 1.393150 1.395002 0.13 1.00 2 4 0.01 0.00 0.01 0.55 0.43 16 1.480820 1.485443 0.31 1.00 5 4 0.70-0.01 0.01 0.06 0.24 17 1.487210 1.486888 -0.02 1.00 1 3 0.47-0.01 0.01 0.11 0.42 18 1.501830 1.500589 -0.08 1.00 7 3 0.02 0.00 0.03 0.00 0.95 19 1.503350 1.503580 0.02 1.00 1 4 0.30 0.01 0.01 0.08 0.60 20 1.525570 1.524154 -0.09 1.00 7 4 0.72 0.00 0.00 0.18 0.10 21 1.527700 1.530233 0.17 1.00 5 5 0.66-0.01 0.04 0.03 0.28 22 1.534700 1.531091 -0.24 1.00 6 4 0.00 0.00 0.04 0.43 0.53 23 1.549320 1.547966 -0.09 1.00 4 3 0.01 0.00 0.03 0.62 0.33 24 1.562710 1.560613 -0.13 1.00 3 3 0.76 0.00 0.00 0.08 0.15 25 1.612020 1.615287 0.20 1.00 8 4 0.01 0.00 0.02 0.45 0.52 26 1.641860 1.643048 0.07 1.00 3 4 0.01 0.00 0.05 0.00 0.95 Bulk Modulus= 116.5 GPa c33 c23 c12 c44 c66 356.7 14.00 26.75 162.2 133.4 d1 d2 d3 0.50540 0.60198 0.40390 loop# 3 rms error= 0.1323 % chisquare increased 2% by the following % changes in independent parameters 0.06 7.55 0.72 -0.02 -0.02 0.01 0.62 -1.81 -0.01 0.11 0.10 -0.54 -0.02 -0.01 -0.02
RUS achieves the highest absolute accuracy on the smallest samples in the least time of any routine elastic modulus measurement technique!
A more complex system: a high-speed heterodyne lock-in for swept frequency work-mostly resonant ultrasound spectroscopy
RUS user facility: J.B. Betts is in charge 290mK-350K 0-15T RT to 900K
Pulse–echo ultrasound measurements can be made in much less time than the duration of a short-pulse magnet shot. A new synchronous approach to signal averaging, data shown at left, sets the NHMFL pulse echo ultrasound system apart from all others. Pulse-echo ultrasound in pulsed magnets
ZAP cell for pulse-echo ultrasound under hydrostatic pressure
Very Raw Data Pulsed Ultrasound Data
References http://www.magnet.fsu.edu/inhouseresearch/rus/index.html