Download
1 / 7
70 likes | 211 Views
Stat 13 lecture 23 correlation and regression. A cartoon from handout The taller the father, the taller the son Tall father’s son is taller than short farther’s son But tall father’s son is not as tall as father; short father’s son is not as short as father Galton’s data. Regression line.

E N D
Stat 13 lecture 23correlation and regression • A cartoon from handout • The taller the father, the taller the son • Tall father’s son is taller than short farther’s son • But tall father’s son is not as tall as father; short father’s son is not as short as father • Galton’s data
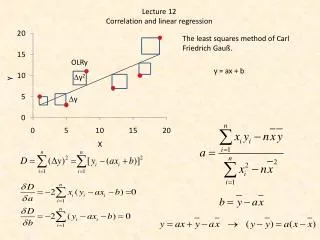
Regression line • The formula : • y=my+r[SD(Y)/SD(X)](x-mx) where my is mean of Y and mx is mean of X • Application : (a) predict IQ at age 35 for someone with IQ of 110 at age 18. • (b) predict IQ at age 35 for someone with IQ 90 of at age 18
Answer • (a) y= 100 + .8 (15/15) (110-100) =108, • Observe that this is greater than average but less than x=110 • (b) y=100+ .8 (15/15) (90-100)=92, • This is smaller than average but is greater than x=90. • This is consistent with the cartoon.
Y SD line is the ideal that data will line up when r=1, perfect correlation situation (inverse)Regression line for predicting X Regression line is the line of prediction ; because r is typically less than 1, it is not as steep as SD line X Slope of SD line = SD(Y)/SD(X) Slope of regression line = r [SD(Y)/SD(X)]